Johnson Controls 2015 Annual Report Download - page 49
Download and view the complete annual report
Please find page 49 of the 2015 Johnson Controls annual report below. You can navigate through the pages in the report by either clicking on the pages listed below, or by using the keyword search tool below to find specific information within the annual report.-
 1
1 -
2
-
3
-
4
-
5
-
6
-
7
-
8
-
9
-
10
-
11
-
12
-
13
-
14
-
15
-
16
-
17
-
18
-
19
-
20
-
21
-
22
-
23
-
24
-
25
-
26
-
27
-
28
-
29
-
30
-
31
-
32
-
33
-
34
-
35
-
36
-
37
-
38
-
 39
39 -
 40
40 -
 41
41 -
 42
42 -
 43
43 -
 44
44 -
 45
45 -
 46
46 -
 47
47 -
 48
48 -
 49
49 -
 50
50 -
 51
51 -
 52
52 -
 53
53 -
 54
54 -
 55
55 -
 56
56 -
 57
57 -
 58
58 -
 59
59 -
60
-
61
-
62
-
63
-
64
-
65
-
66
-
67
-
68
-
69
-
70
-
71
-
72
-
73
-
74
-
75
-
76
-
77
-
78
-
79
-
80
-
81
-
82
-
83
-
84
-
85
-
86
-
87
-
88
-
89
-
90
-
91
-
92
-
93
-
94
-
95
-
96
-
97
-
98
-
99
-
100
-
101
-
102
-
103
-
104
-
105
-
106
-
107
-
108
-
109
-
110
-
111
-
112
-
113
-
114
-
115
-
116
-
117
-
118
-
119
-
120
-
121
 |
 |
49
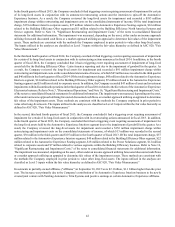
corresponding spot yield curve rates. This change does not affect the measurement of the total benefit obligations or annual net
periodic benefit cost (credit) as the change in the service and interest costs is completely offset in the net actuarial (gain) loss
reported. The change in the service and interest costs going forward is not expected to be significant. The Company has accounted
for this change as a change in accounting estimate.
In estimating the expected return on plan assets, the Company considers the historical returns on plan assets, adjusted for forward-
looking considerations, inflation assumptions and the impact of the active management of the plans’ invested assets. Reflecting
the relatively long-term nature of the plans’ obligations, approximately 44% of the plans’ assets are invested in fixed income
securities and 37% in equity securities, with the remainder primarily invested in alternative investments. For the years ending
September 30, 2015 and 2014, the Company’s expected long-term return on U.S. pension plan assets used to determine net periodic
benefit cost was 7.50% and 8.00%, respectively. The actual rate of return on U.S. pension plans was below 7.50% in fiscal 2015
and above 8.00% in fiscal 2014. For the years ending September 30, 2015 and 2014, the Company’s weighted average expected
long-term return on non-U.S. pension plan assets was 4.50% and 4.75%, respectively. The actual rate of return on non-U.S. pension
plans approximated 4.50% in fiscal 2015 and was above 4.75% in fiscal 2014. For the years ending September 30, 2015 and 2014,
the Company’s weighted average expected long-term return on postretirement plan assets was 5.75% and 5.80%, respectively.
The actual rate of return on postretirement plan assets was below 5.75% in fiscal 2015 and approximated 5.80% in fiscal 2014.
Beginning in fiscal 2016, the Company believes the long-term rate of return will approximate 7.50%, 4.50% and 5.50% for U.S.
pension, non-U.S. pension and postretirement plans, respectively. Any differences between actual investment results and the
expected long-term asset returns will be reflected in net periodic benefit costs in the fourth quarter of each fiscal year. If the
Company’s actual returns on plan assets are less than the Company’s expectations, additional contributions may be required.
In fiscal 2015, total employer contributions to the defined benefit pension plans were $407 million, of which $317 million were
voluntary contributions made by the Company. The Company expects to contribute approximately $113 million in cash to its
defined benefit pension plans in fiscal 2016. In fiscal 2015, total employer contributions to the postretirement plans were $2 million.
The Company does not expect to make any significant contributions to its postretirement plans in fiscal year 2016.
Based on information provided by its independent actuaries and other relevant sources, the Company believes that the assumptions
used are reasonable; however, changes in these assumptions could impact the Company’s financial position, results of operations
or cash flows.
Product Warranties
The Company offers warranties to its customers depending upon the specific product and terms of the customer purchase agreement.
A typical warranty program requires that the Company replace defective products within a specified time period from the date of
sale. The Company records an estimate of future warranty-related costs based on actual historical return rates and other known
factors. Based on analysis of return rates and other factors, the Company’s warranty provisions are adjusted as necessary. At
September 30, 2015, the Company had recorded $300 million of warranty reserves, including extended warranties for which
deferred revenue is recorded. The Company monitors its warranty activity and adjusts its reserve estimates when it is probable
that future warranty costs will be different than those estimates. Refer to Note 7, "Product Warranties," of the notes to consolidated
financial statements for disclosure of the Company's product warranty liabilities.
Income Taxes
The Company accounts for income taxes in accordance with ASC 740, "Income Taxes." Deferred tax assets and liabilities are
recognized for the future tax consequences attributable to differences between financial statement carrying amounts of existing
assets and liabilities and their respective tax bases and operating loss and other loss carryforwards. Deferred tax assets and liabilities
are measured using enacted tax rates expected to apply to taxable income in the years in which those temporary differences are
expected to be recovered or settled. The Company records a valuation allowance that primarily represents non-U.S. operating and
other loss carryforwards for which realization is uncertain. Management judgment is required in determining the Company’s
provision for income taxes, deferred tax assets and liabilities, and the valuation allowance recorded against the Company’s net
deferred tax assets. In calculating the provision for income taxes on an interim basis, the Company uses an estimate of the annual
effective tax rate based upon the facts and circumstances known at each interim period. On a quarterly basis, the actual effective
tax rate is adjusted as appropriate based upon the actual results as compared to those forecasted at the beginning of the fiscal year.
The Company reviews the realizability of its deferred tax asset valuation allowances on a quarterly basis, or whenever events or
changes in circumstances indicate that a review is required. In determining the requirement for a valuation allowance, the historical
and projected financial results of the legal entity or consolidated group recording the net deferred tax asset are considered, along
with any other positive or negative evidence. Since future financial results may differ from previous estimates, periodic adjustments