INTL FCStone 2014 Annual Report Download - page 9
Download and view the complete annual report
Please find page 9 of the 2014 INTL FCStone annual report below. You can navigate through the pages in the report by either clicking on the pages listed below, or by using the keyword search tool below to find specific information within the annual report.-
 1
1 -
 2
2 -
 3
3 -
 4
4 -
 5
5 -
 6
6 -
 7
7 -
 8
8 -
 9
9 -
 10
10 -
 11
11 -
 12
12 -
 13
13 -
 14
14 -
 15
15 -
 16
16 -
 17
17 -
 18
18 -
 19
19 -
 20
20 -
21
-
22
-
23
-
24
-
25
-
26
-
27
-
28
-
29
-
30
-
31
-
32
-
33
-
34
-
35
-
36
-
37
-
38
-
39
-
40
-
41
-
42
-
43
-
44
-
45
-
46
-
47
-
48
-
49
-
50
-
51
-
52
-
53
-
54
-
55
-
56
-
57
-
58
-
59
-
60
-
61
-
62
-
63
-
64
-
65
-
66
-
67
-
68
-
69
-
70
-
71
-
72
-
73
-
74
-
75
-
76
-
77
-
78
-
79
-
80
-
81
-
82
-
83
-
84
-
85
-
86
-
87
-
88
-
89
-
90
-
91
-
92
-
93
-
94
-
95
-
96
-
97
-
98
-
99
-
100
-
101
-
102
-
103
-
104
-
105
-
106
-
107
-
108
-
109
-
110
-
111
-
112
-
113
-
114
-
115
-
116
-
117
-
118
-
119
-
120
-
121
-
122
-
123
-
124
-
125
-
126
-
127
-
128
-
129
-
130
-
131
-
132
-
133
-
134
-
135
-
136
-
137
-
138
-
139
-
140
 |
 |

and invested in building a global, multi-asset-class
infrastructure to best serve our growing client base.
This was an expensive and
time-consuming endeavor
that has certainly weighed
on our earnings over the
past few years, but we feel
we are now emerging as a
“best-in-class” mid-market
nancial franchise that has a
unique set of capabilities, well
placed to take advantage of a
continuing consolidation of the
industry. We believe that this
consolidation is still in its early
stages, and is being driven by
increased infrastructure costs
and capital requirements for
the smaller players rendering
them uneconomic, while the
larger banks have been focusing on their larger core
clients at the expense of the mid-sized clients we
seek to serve. Most clients we target are generally
looking to transact with fewer but better capitalized
entities that offer a well-rounded menu of services
and capabilities – a role for which we believe we are
eminently well suited.
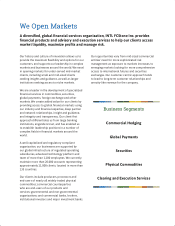
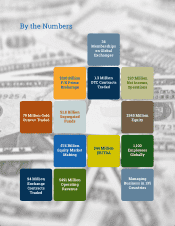
We provide our 20,000 accounts with:
• Advice, specialized market intelligence and
insight to allow them to effectively utilize
markets to manage risks and/or enhance
returns
• Efcient execution by providing access to
global liquidity sources from exchanges to
Swap Execution Facilities (“SEF”) and over the
counter (“OTC”) counterparts
• Clearing and prime brokerage post-trade
services
We provide these services across asset classes,
including all commodity verticals; securities, including
equities and xed income; foreign exchange; and
select physical markets. In the provision of these
services, we provide access to a full product suite from
spot, futures and forwards to
options and highly structured
transactions designed around
our clients’ needs.
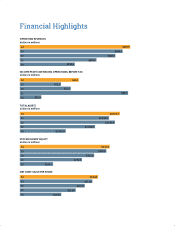
FINANCIAL RESULTS
We were encouraged to see
that our core Commercial
Hedging segment, which in the
past few scal years has been
negatively impacted by low
volatility, a North American
drought and turmoil in the
Futures Commission Merchant
(FCM) sector, began exhibiting
signs that it will perform at
a level consistent with our
expectations. Our exchange-
traded business was driven principally by improving
domestic agricultural markets as well as continued
volume growth in our London Metal Exchange (LME)
metals business, due in part to our expansion in Asian
markets.
The OTC volume growth was driven by increases
in energy and renewable fuels customer activity,
partially offset by a decline in hedging volumes in
Brazil. Deposits held on behalf of our commodity
customers, which is a source of interest income, also
increased 7% over FY2013 to $1.8 billion. However,
as in recent years, historically low short-term interest
rates have functioned as a signicant constraint on
our interest income from customer deposits.
Operating revenues in our Global Payments segment
experienced strong growth compared to the prior
scal year, which had also been a strong year for this
segment. Net operating revenues for this segment
reached $48.2 million, a 31% increase over the
previous year. This pattern of growth is attributable in
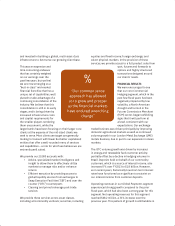
“Our common sense
approach has allowed
us to grow and prosper
as the nancial markets
have endured wrenching
change”