INTL FCStone 2014 Annual Report Download - page 10
Download and view the complete annual report
Please find page 10 of the 2014 INTL FCStone annual report below. You can navigate through the pages in the report by either clicking on the pages listed below, or by using the keyword search tool below to find specific information within the annual report.-
 1
1 -
 2
2 -
 3
3 -
 4
4 -
 5
5 -
 6
6 -
 7
7 -
 8
8 -
 9
9 -
 10
10 -
 11
11 -
 12
12 -
 13
13 -
 14
14 -
 15
15 -
 16
16 -
 17
17 -
 18
18 -
 19
19 -
 20
20 -
 21
21 -
22
-
23
-
24
-
25
-
26
-
27
-
28
-
29
-
30
-
31
-
32
-
33
-
34
-
35
-
36
-
37
-
38
-
39
-
40
-
41
-
42
-
43
-
44
-
45
-
46
-
47
-
48
-
49
-
50
-
51
-
52
-
53
-
54
-
55
-
56
-
57
-
58
-
59
-
60
-
61
-
62
-
63
-
64
-
65
-
66
-
67
-
68
-
69
-
70
-
71
-
72
-
73
-
74
-
75
-
76
-
77
-
78
-
79
-
80
-
81
-
82
-
83
-
84
-
85
-
86
-
87
-
88
-
89
-
90
-
91
-
92
-
93
-
94
-
95
-
96
-
97
-
98
-
99
-
100
-
101
-
102
-
103
-
104
-
105
-
106
-
107
-
108
-
109
-
110
-
111
-
112
-
113
-
114
-
115
-
116
-
117
-
118
-
119
-
120
-
121
-
122
-
123
-
124
-
125
-
126
-
127
-
128
-
129
-
130
-
131
-
132
-
133
-
134
-
135
-
136
-
137
-
138
-
139
-
140
 |
 |

large part to the continued acquisition of commercial
bank clients and the successful implementation of
a new back-ofce platform that now enables us to
process increased volumes, including smaller notional
payments, without the hiring of additional support
personnel.
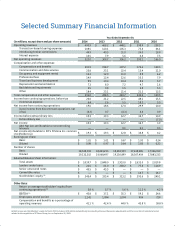
All product lines in our Securities business grew in
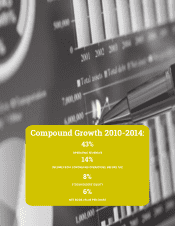
FY2014, driving net operating revenues up by 14%
over FY2013. Leading this growth were double-digit
increases in debt trading and asset management
revenues, resulting from favorable market conditions
both domestically and in South America.
Net operating revenues in our Clearing and Execution
Services (CES) segment declined $4.4 million versus
the previous year. However, our efforts to transform
this business yielded results as the bottom line
increased slightly as our
margins improved and
expenses declined.
Our overall nancial
performance was
negatively impacted by
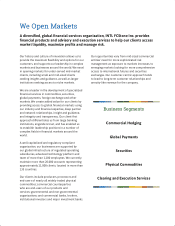
a revenue decline in our
Physical Commodities
segment. This segment will
continue to be the focus
of renewed emphasis in
the coming scal year,
with the goal of realizing
improved results by the
end of the coming scal
year.
Our performance on the expense side of the equation
was relatively encouraging during the past scal
year, as our xed expenses declined 2%, or $3.1
million, compared to the previous year. This was
despite increasing expenses associated with growing
regulatory requirements and increased data costs
from exchanges. Variable expenses were 56% of total
expenses in FY2014, which was a slight improvement
over the previous year. Total non-variable expenses,
which include xed expenses as well as bad debts and
impairments, increased 1% to $202.1 million in FY2014.
The past scal year also marked the completion of
the consolidation of our U.K. subsidiaries, forming
one nancial services rm permitted to provide all
nancial services with the exception of deposit-
taking and fund management; and the initiation of
a similar process to consolidate our North American
subsidiaries, a process that will continue through the
coming scal year. This consolidation will allow us
to provide all of our products more seamlessly to our
growing client base as well as leverage our capital
and infrastructure more effectively and efciently.
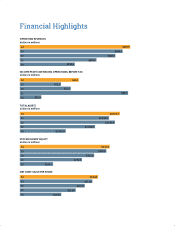
We concluded FY2014 in a strong nancial position,
aided in good measure by the
restructuring of our bank facilities
and the issuance of senior notes in
the previous year. We ended the
current scal year with $22.5 million
in outstanding borrowings versus
$270 million in committed facilities.
Total assets were at $3.04 billion at
the end of the FY2014, a 7% increase
over the prior year.
Shareholders’ equity continued to
trend upward compared to previous
years, and reached $345.4 million
at the end of the scal year. Our net
income attributable to INTL FCStone
common stockholders reached $19.3
million, a slight increase over the previous scal year,
and book value per outstanding share also increased
to $18.29.
As discussed in the Selected Financial Data section
of this Report, our Return on Equity, though slightly
improved at 6% over FY2013, still falls short of our
Chief Executive’s Report cont’d.
“We concluded FY2014 in
a strong nancial position”