Huntington National Bank 2005 Annual Report Download - page 8
Download and view the complete annual report
Please find page 8 of the 2005 Huntington National Bank annual report below. You can navigate through the pages in the report by either clicking on the pages listed below, or by using the keyword search tool below to find specific information within the annual report.-
 1
1 -
 2
2 -
 3
3 -
 4
4 -
 5
5 -
 6
6 -
 7
7 -
 8
8 -
 9
9 -
 10
10 -
 11
11 -
 12
12 -
 13
13 -
 14
14 -
 15
15 -
 16
16 -
 17
17 -
 18
18 -
 19
19 -
20
-
21
-
22
-
23
-
24
-
25
-
26
-
27
-
28
-
29
-
30
-
31
-
32
-
33
-
34
-
35
-
36
-
37
-
38
-
39
-
40
-
41
-
42
-
43
-
44
-
45
-
46
-
47
-
48
-
49
-
50
-
51
-
52
-
53
-
54
-
55
-
56
-
57
-
58
-
59
-
60
-
61
-
62
-
63
-
64
-
65
-
66
-
67
-
68
-
69
-
70
-
71
-
72
-
73
-
74
-
75
-
76
-
77
-
78
-
79
-
80
-
81
-
82
-
83
-
84
-
85
-
86
-
87
-
88
-
89
-
90
-
91
-
92
-
93
-
94
-
95
-
96
-
97
-
98
-
99
-
100
-
101
-
102
-
103
-
104
-
105
-
106
-
107
-
108
-
109
-
110
-
111
-
112
-
113
-
114
-
115
-
116
-
117
-
118
-
119
-
120
-
121
-
122
-
123
-
124
-
125
-
126
-
127
-
128
-
129
-
130
-
131
-
132
-
133
-
134
-
135
-
136
-
137
-
138
-
139
-
140
-
141
-
142
 |
 |

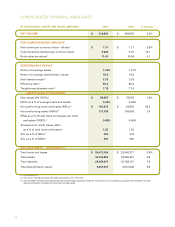
CONSOLIDATED FINANCIAL HIGHLIGHTS
IN THOUSANDS, EXCEPT PER SHARE AMOUNTS 2005 2004 % Change
NET INCOME $ 412,091 $ 398,925 3.3%
PER COMMON SHARE AMOUNTS
Net income per common share – diluted $ 1.77 $ 1.71 3.5%
Cash dividends declared per common share 0.845 0.75 12.7
Book value per share(1) 11.41 10.96 4.1
PERFORMANCE RATIOS
Return on average assets 1.26% 1.27%
Return on average shareholders’ equity 16.0 16.8
Net interest margin(2) 3.33 3.33
Effi ciency ratio(3) 60.0 65.0
Tangible equity/assets ratio(1) 7.19 7.18
CREDIT QUALITY MEASURES
Net charge-offs (NCOs) $ 80,057 $ 78,535 1.9%
NCOs as a % of average loans and leases 0.33% 0.35%
Non-performing loans and leases (NPLs)(1) $ 101,915 $ 63,962 59.3
Non-performing assets (NPAs)(1) 117,155 108,568 7.9
NPAs as a % of total loans and leases and other
real estate (OREO)(1) 0.48% 0.46%
Allowance for credit losses (ACL)
as a % of total loans and leases(1) 1.25 1.29
ACL as a % of NPLs(1) 300 476
ACL as a % of NPAs(1) 261 280
BALANCE SHEET – DECEMBER 31,
Total loans and leases $ 24,472,166 $ 23,560,277 3.9%
Total assets 32,764,805 32,565,497 0.6
Total deposits 22,409,675 20,768,161 7.9
Total shareholders’ equity 2,557,501 2,537,638 0.8
(1) AT DECEMBER 31.
(2) ON A FULLY TAXABLE EQUIVALENT BASIS ASSUMING A 35% TAX RATE.
(3) NON-INTEREST EXPENSE LESS AMORTIZATION OF INTANGIBLE ASSETS DIVIDED BY THE SUM OF FULLY TAXABLE EQUIVALENT NET INTEREST INCOME
AND NON-INTEREST INCOME EXCLUDING SECURITIES GAINS.
6