Huntington National Bank 2005 Annual Report Download - page 5
Download and view the complete annual report
Please find page 5 of the 2005 Huntington National Bank annual report below. You can navigate through the pages in the report by either clicking on the pages listed below, or by using the keyword search tool below to find specific information within the annual report.-
 1
1 -
 2
2 -
 3
3 -
 4
4 -
 5
5 -
 6
6 -
 7
7 -
 8
8 -
 9
9 -
 10
10 -
 11
11 -
 12
12 -
 13
13 -
 14
14 -
 15
15 -
 16
16 -
17
-
18
-
19
-
20
-
21
-
22
-
23
-
24
-
25
-
26
-
27
-
28
-
29
-
30
-
31
-
32
-
33
-
34
-
35
-
36
-
37
-
38
-
39
-
40
-
41
-
42
-
43
-
44
-
45
-
46
-
47
-
48
-
49
-
50
-
51
-
52
-
53
-
54
-
55
-
56
-
57
-
58
-
59
-
60
-
61
-
62
-
63
-
64
-
65
-
66
-
67
-
68
-
69
-
70
-
71
-
72
-
73
-
74
-
75
-
76
-
77
-
78
-
79
-
80
-
81
-
82
-
83
-
84
-
85
-
86
-
87
-
88
-
89
-
90
-
91
-
92
-
93
-
94
-
95
-
96
-
97
-
98
-
99
-
100
-
101
-
102
-
103
-
104
-
105
-
106
-
107
-
108
-
109
-
110
-
111
-
112
-
113
-
114
-
115
-
116
-
117
-
118
-
119
-
120
-
121
-
122
-
123
-
124
-
125
-
126
-
127
-
128
-
129
-
130
-
131
-
132
-
133
-
134
-
135
-
136
-
137
-
138
-
139
-
140
-
141
-
142
 |
 |

3
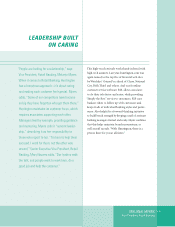
To improve associate focus on our customers, we formally adopted a value proposition of service excellence. Our
objective is to offer our customers a “Simply the Best” service experience in every transaction, every time. Making this
behavior second nature for every associate is one of our highest priorities. We are devoting extensive time, energy, and
training to make this not just an aspiration, but also a reality. If we are successful, it will be our strongest competitive
advantage, and there are signs of progress. A recent outside, independent company surveyed banking customers in our
key markets and found that Huntington ranked #1 in customer service over our six largest Midwest banking competitors.
For Huntington to be a winning competitor and reward our shareholders, all of this has to translate into improved
fi nancial performance and above average shareholder returns. On both, we also made progress.
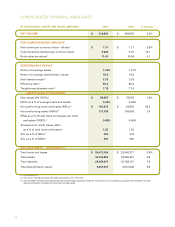
Earnings per common share for 2005 were $1.77, compared to $0.54 in 2001, and return on equity was 16.0%, up from
5.8%, even with higher relative capital. Throughout this period, our net interest margin remained relatively stable, a
notable achievement during a period of volatile interest rates and given that we operate in some of the most competitive
loan and deposit markets in the country. Average loans grew at least 10% in each of the last three years and average
core deposits 5% in each of the last two years. Trust services income consistently increased and was 28% higher last
year than in 2001. Our focus on controlling expenses and growing revenues is refl ected in the improvement in our
expense effi ciency ratio from 79% in 2001 to 60% last year.
The efforts made to strengthen our credit underwriting, review, and workout disciplines resulted in a much improved
credit risk profi le. We exited large, shared national credits and other large, individual non-relationship credits and
lowered our automobile lending exposure to 18% from 33%. Our NPA ratio declined from 1.23% at the end of 2001,
to 0.48% at the end of 2005. Over this same period, our net charge-off ratio dropped from 0.81% to 0.33%, and our
provision for credit losses declined 68% from $257 million to $81 million.
A foundational Huntington objective is to deliver above average total returns to our shareholders. There are three
ways to do this: (1) above average growth in earnings, (2) share repurchases, and (3) increased dividends. We believe
that the economic and competitive environment over the next three years is going to be tougher, with slower growth.
As such, we expect growth in earnings per share to be below our 10%-12% long-term targeted range. Given that we
expect to continue to generate excess capital, we have looked to both share repurchases and dividend increases as a
way to enhance shareholder returns. Since the end of 2001, we have repurchased 33.1 million shares, or 13% of the
shares outstanding at that time.
In July 2001, we made the diffi cult but necessary decision to cut the dividend 20%. Since that time, our fi nancial
progress has enabled us to increase cash dividends per share by 56%, including a 16% increase declared by the board
of directors in January 2006. This increase results in a dividend payout ratio above our long-term targeted payout
range of 40%-50%, which is warranted in the current, slower growth environment.
From the end of 2000, we delivered a total average annual shareholder return of 11.9%, including the reinvestment of
dividends. This is higher than the 7.2% total return for the S&P Bank Index. Our stock price at the end of 2005 was
$23.75, and represented a 47% increase from $16.19 at the end of 2000, or an average annual increase of 8.0%.
In sum, we have accomplished much over the last fi ve years and are well positioned for success in 2006.