Harley Davidson 2010 Annual Report Download - page 17
Download and view the complete annual report
Please find page 17 of the 2010 Harley Davidson annual report below. You can navigate through the pages in the report by either clicking on the pages listed below, or by using the keyword search tool below to find specific information within the annual report.-
 1
1 -
2
-
3
-
4
-
5
-
6
-
 7
7 -
 8
8 -
 9
9 -
 10
10 -
 11
11 -
 12
12 -
 13
13 -
 14
14 -
 15
15 -
 16
16 -
 17
17 -
 18
18 -
 19
19
 |
 |
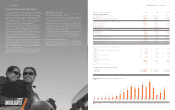
Financial Performance Summary
In 2010, Harley-Davidson’s revenue from motorcycles and related
products on a continuing operations basis decreased 2.6 percent
to $4.18 billion compared to 2009, and income from continuing
operations increased 267.6 percent from the prior year to $259.7
million. These results reect improved operating margin
for the Company’s motorcycle business, strong operating income
at Harley-Davidson Financial Services and the impact of
restructuring charges and a 2010 debt repurchase.
Revenue from sales of Harley-Davidson motorcycles decreased
to $3.14 billion in 2010, a decline of 1.2 percent from 2009,
on a 5.6 percent reduction in shipments of Harley-Davidson
motorcycles. Revenue from Genuine Parts and Accessories
in 2010 totaled $749.2 million, a 2.4 percent decrease from the
previous year, and General Merchandise revenue was $259.1
million, a decrease of 8.2 percent compared to 2009.
During 2010, Harley-Davidson took actions to lower its cost
structure through eliminating excess capacity, reducing
administrative costs and exiting non-core business operations.
Harley-Davidson expects restructuring activities announced
since 2009, including those announced in early 2011 related to
Kansas City Vehicle Operations, to deliver between $305 million
and $325 million in annual ongoing savings upon completion
of those restructuring activities.
Harley-Davidson’s share price increased 37.6 percent during
2010 and the Company paid out dividends of $.40 per share in 2010.
Harley-Davidson has paid a dividend every year since 1993.
Harley-Davidson Motorcycles
Worldwide retail sales of Harley-Davidson motorcycles declined
8.5 percent in 2010 compared to 2009.
In the United States, 2010 retail sales of 143,391 Harley-Davidson
motorcycles decreased 11.7 percent from 2009 and overall U.S.
heavyweight market registrations declined 14.6 percent. For the full
year 2010, retail sales of Harley-Davidson motorcycles in our
international markets decreased 1.9 percent compared to 2009.
For the same period, retail sales of Harley-Davidson motorcycles
increased 3.0 percent in the Europe Region and 5.4 percent in
the Latin America Region, and decreased 9.0 percent in Canada
and 8.7 percent in the Asia Pacic Region.
In 2010, the Company shipped 210,494 Harley-Davidson motor-
cycles worldwide, compared to 223,023 in 2009. In 2010,
37.5 percent of the Harley-Davidson motorcycles shipped went
to international markets compared to 35.2 percent in 2009.
Harley-Davidson Financial Services
Financial Services recorded operating income of $181.9 million in
2010 compared to an operating loss of $118.0 million in 2009.
HDFS’ business benetted from a lower cost of funds and improved
credit performance compared to last year.
In thousands, except per-share amounts 2010 2009 2008
Statement of Operations Data:
Motorcycles and related products revenue $ 4,176,627 $ 4,287,130 $ 5,578,414
Gross profit 1,427,403 1,386,196 1,931,144
Selling, administrative and engineering expense 885,137 851,165 942,267
Restructuring expense and other impairments 163,508 220,976 12,475
Operating income from motorcycles & related products 378,758 314,055 976,402
Financial services revenue 682,709 494,779 376,970
Financial services expense 500,836 581,059 294,205
Restructuring expense – 3,302 –
Goodwill impairment – 28,387 –
Operating income (loss) from nancial services 181,873 (117,969) 82,765
Operating income 560,631 196,086 1,059,167
Investment income 5,442 4,254 11,296
Interest expense 90,357 21,680 4,542
Loss on debt extinguishment 85,247 – –
Income before provision for income taxes 390,469 178,660 1,065,921
Provision for income taxes 130,800 108,019 381,686
Income from continuing operations 259,669 70,641 684,235
Loss from discontinued operations, net of tax (113,124) (125,757) (29,517)
Net income (loss) $ 146,545 $ (55,116) $ 654,718
Earnings per common share from continuing operations:
Basic $ 1.11 $ 0.30 $ 2.92
Diluted $ 1.11 $ 0.30 $ 2.92
Loss per common share from discontinued operations:
Basic $ (0.48) $ (0.54) $ (0.13)
Diluted $ (0.48) $ (0.54) $ (0.13)
Earnings (loss) per common share:
Basic $ 0.63 $ (0.24) $ 2.80
Diluted $ 0.62 $ (0.24) $ 2.79
Weighted-average common shares:
Basic 233,312 232,577 234,225
Diluted 234,787 233,573 234,477
Cash dividends per common share $ 0.40 $ 0.40 $ 1.29
Consolidated Balance Sheet Data (at December 31):
Total assets $ 9,430,740 $ 9,155,518 $ 7,828,625
Total debt $ 5,752,356 $ 5,636,129 $ 3,914,887
Total equity $ 2,206,866 $ 2,108,118 $ 2,115,603
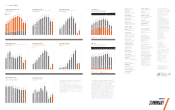
25,000
20,000
15,000
10,000
5,000
0
999897969594939291 0605040200 01 03 07 08
204
852
220
1,433
242
1,686
245
2,152
337
2,224
414
3,650
553
4,257
710
7,434
860
10,084
782
12,544
689
17,169
537
14,645
690
15,133
766
19,476
803
16,709
930
23,191
981
15,687
618
5,956
09
782
9,061
10
899
12,641
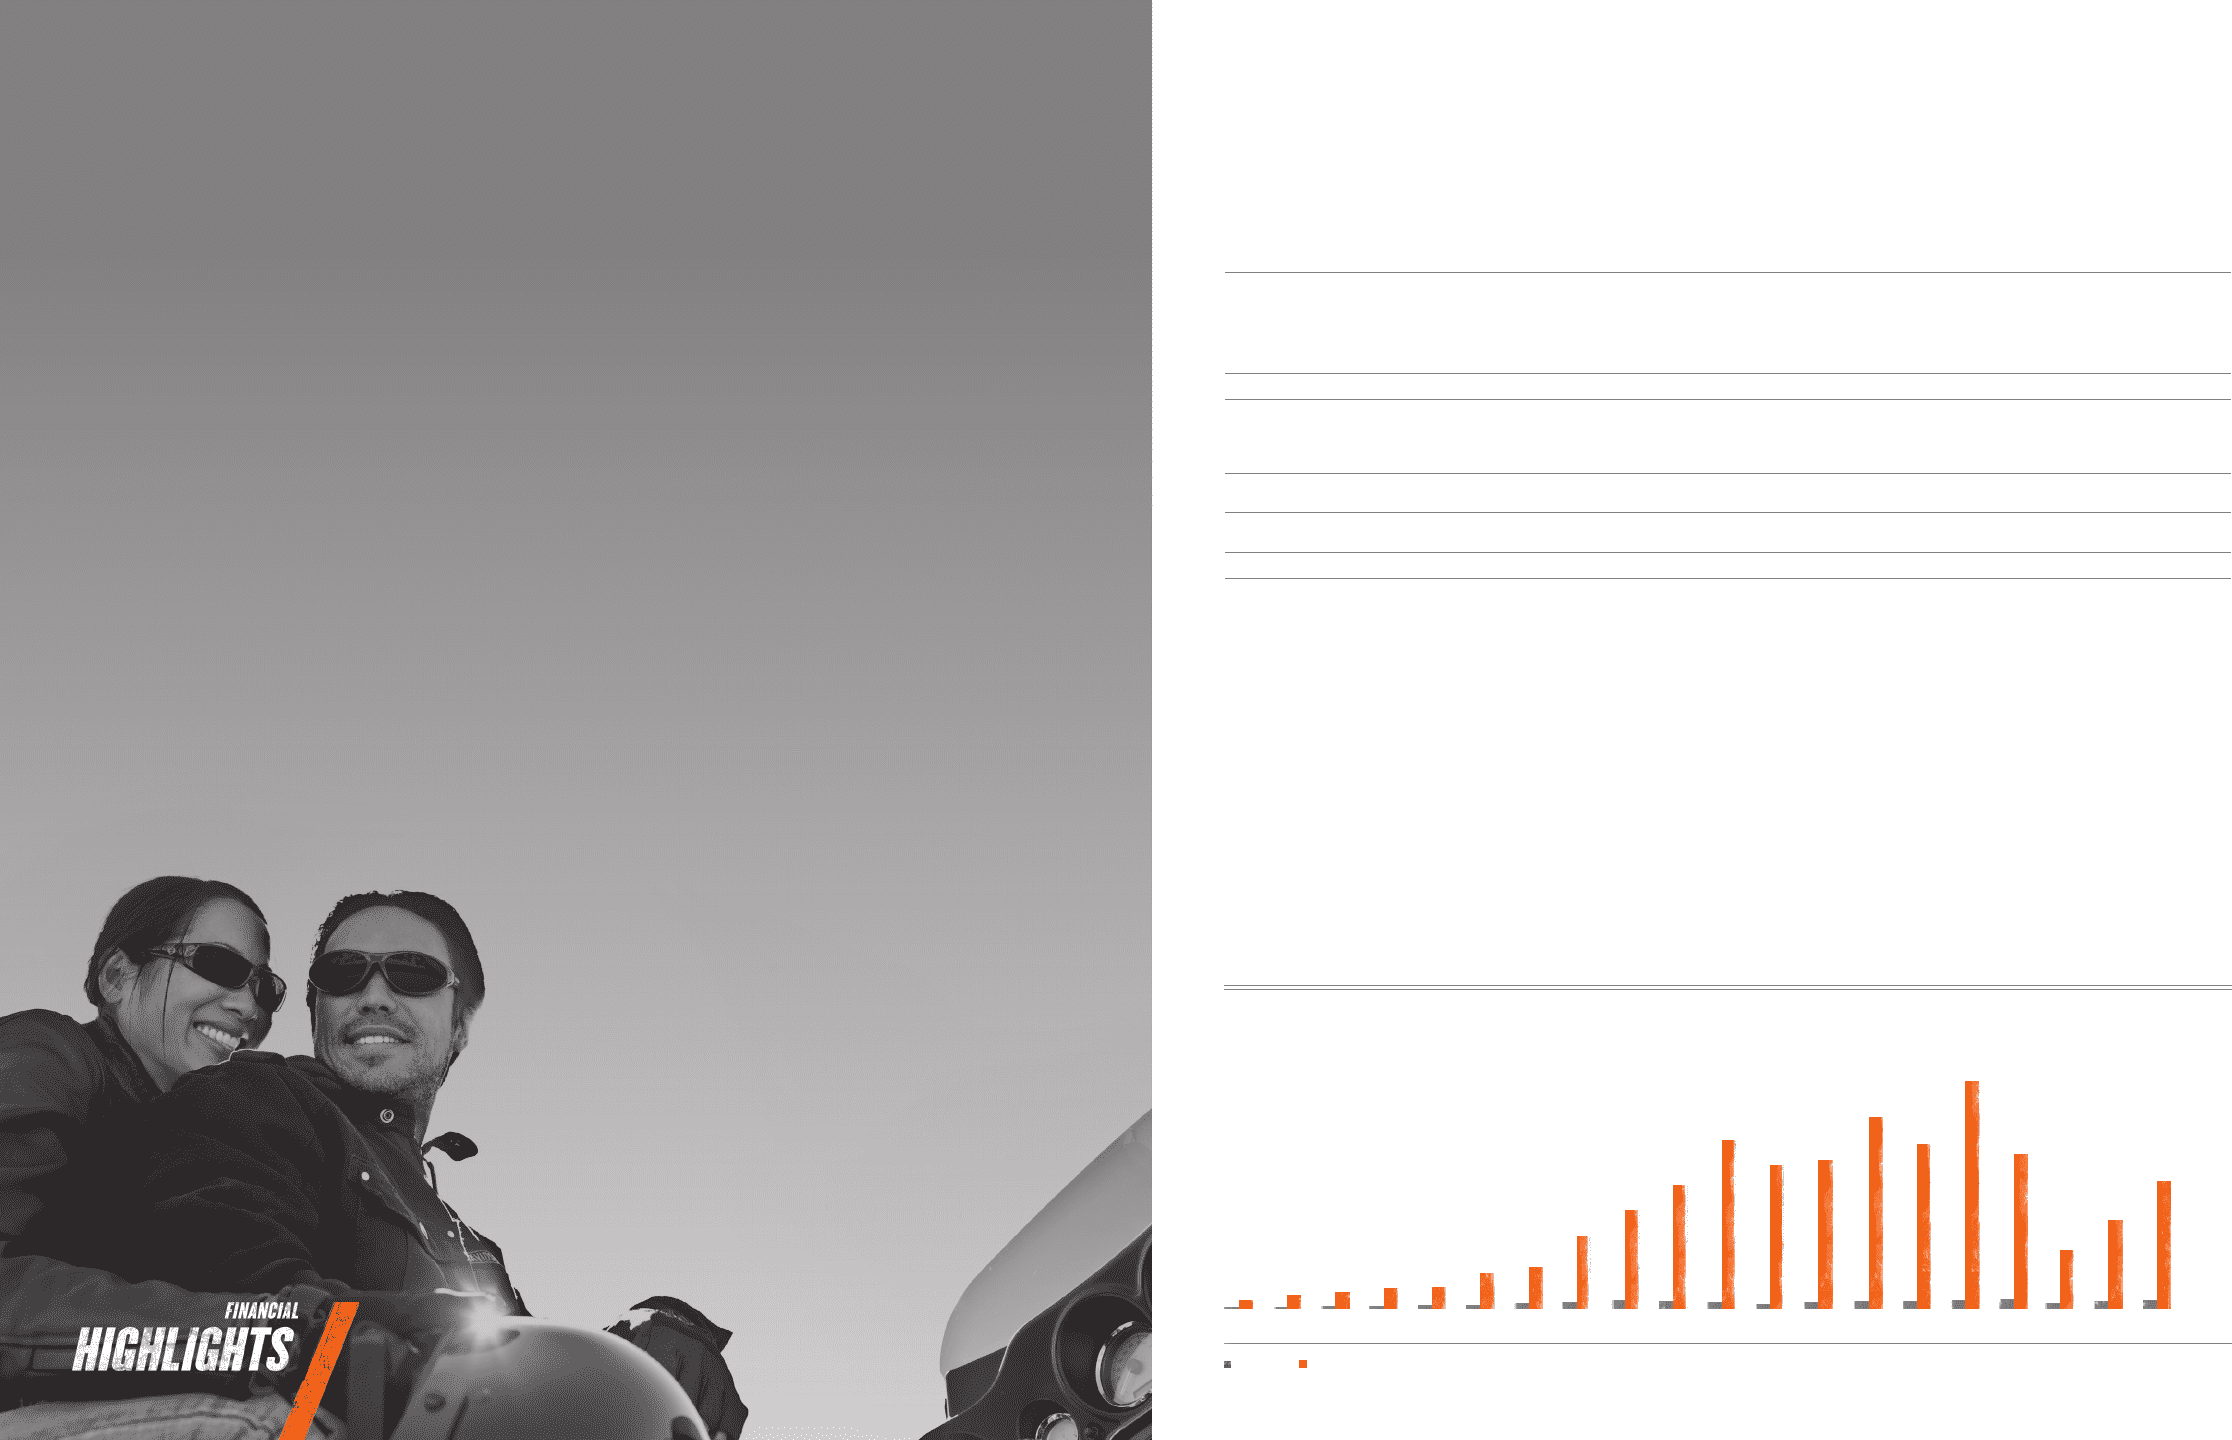
Harley-Davidson, Inc. vs. Standard & Poor’s 500 Composite Index
In dollars
30 Financial Highlights 31
S&P 500 Comparison of year-end value of $100 invested Dec. 31, 1986 (20 Years Shown). Assumes for both Harley-Davidson and S&P that all dividends are reinvested.H-D
Harley-Davidson, Inc. 2010 Annual Report