Freddie Mac 2009 Annual Report Download - page 7
Download and view the complete annual report
Please find page 7 of the 2009 Freddie Mac annual report below. You can navigate through the pages in the report by either clicking on the pages listed below, or by using the keyword search tool below to find specific information within the annual report.-
 1
1 -
 2
2 -
 3
3 -
 4
4 -
 5
5 -
 6
6 -
 7
7 -
 8
8 -
 9
9 -
 10
10 -
 11
11 -
 12
12 -
 13
13 -
 14
14 -
 15
15 -
 16
16 -
 17
17 -
 18
18 -
19
-
20
-
21
-
22
-
23
-
24
-
25
-
26
-
27
-
28
-
29
-
30
-
31
-
32
-
33
-
34
-
35
-
36
-
37
-
38
-
39
-
40
-
41
-
42
-
43
-
44
-
45
-
46
-
47
-
48
-
49
-
50
-
51
-
52
-
53
-
54
-
55
-
56
-
57
-
58
-
59
-
60
-
61
-
62
-
63
-
64
-
65
-
66
-
67
-
68
-
69
-
70
-
71
-
72
-
73
-
74
-
75
-
76
-
77
-
78
-
79
-
80
-
81
-
82
-
83
-
84
-
85
-
86
-
87
-
88
-
89
-
90
-
91
-
92
-
93
-
94
-
95
-
96
-
97
-
98
-
99
-
100
-
101
-
102
-
103
-
104
-
105
-
106
-
107
-
108
-
109
-
110
-
111
-
112
-
113
-
114
-
115
-
116
-
117
-
118
-
119
-
120
-
121
-
122
-
123
-
124
-
125
-
126
-
127
-
128
-
129
-
130
-
131
-
132
-
133
-
134
-
135
-
136
-
137
-
138
-
139
-
140
-
141
-
142
-
143
-
144
-
145
-
146
-
147
-
148
-
149
-
150
-
151
-
152
-
153
-
154
-
155
-
156
-
157
-
158
-
159
-
160
-
161
-
162
-
163
-
164
-
165
-
166
-
167
-
168
-
169
-
170
-
171
-
172
-
173
-
174
-
175
-
176
-
177
-
178
-
179
-
180
-
181
-
182
-
183
-
184
-
185
-
186
-
187
-
188
-
189
-
190
-
191
-
192
-
193
-
194
-
195
-
196
-
197
-
198
-
199
-
200
-
201
-
202
-
203
-
204
-
205
-
206
-
207
-
208
-
209
-
210
-
211
-
212
-
213
-
214
-
215
-
216
-
217
-
218
-
219
-
220
-
221
-
222
-
223
-
224
-
225
-
226
-
227
-
228
-
229
-
230
-
231
-
232
-
233
-
234
-
235
-
236
-
237
-
238
-
239
-
240
-
241
-
242
-
243
-
244
-
245
-
246
-
247
-
248
-
249
-
250
-
251
-
252
-
253
-
254
-
255
-
256
-
257
-
258
-
259
-
260
-
261
-
262
-
263
-
264
-
265
-
266
-
267
-
268
-
269
-
270
-
271
-
272
-
273
-
274
-
275
-
276
-
277
-
278
-
279
-
280
-
281
-
282
-
283
-
284
-
285
-
286
-
287
-
288
-
289
-
290
-
291
-
292
-
293
-
294
-
295
-
296
-
297
-
298
-
299
-
300
-
301
-
302
-
303
-
304
-
305
-
306
-
307
-
308
-
309
-
310
-
311
-
312
-
313
-
314
-
315
-
316
-
317
-
318
-
319
-
320
-
321
-
322
-
323
-
324
-
325
-
326
-
327
-
328
-
329
-
330
-
331
-
332
-
333
-
334
-
335
-
336
-
337
-
338
-
339
-
340
-
341
-
342
-
343
-
344
-
345
-
346
-
347
 |
 |

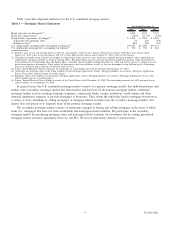
Table 1 provides important indicators for the U.S. residential mortgage market.
Table 1 — Mortgage Market Indicators
2009 2008 2007
Year Ended December 31,
Home sale units (in thousands)
(1)
....................................................... 4,940 4,835 5,715
Home price depreciation
(2)
........................................................... (0.8)% (11.7)% (4.8)%
Single-family originations (in billions)
(3)
................................................. $ 1,815 $ 1,500 $ 2,430
Adjustable-rate mortgage share
(4)
..................................................... 7% 13% 29%
Refinance share
(5)
............................................................... 68% 50% 46%
U.S. single-family mortgage debt outstanding (in billions)
(6)
.................................... $10,852 $11,005 $11,113
U.S. multifamily mortgage debt outstanding (in billions)
(6)
..................................... $ 912 $ 910 $ 844
(1) Includes sales of new and existing homes in the U.S. and excludes condos/co-ops. Source: National Association of Realtors news release dated
January 25, 2010 (sales of existing homes) and U.S. Census Bureau news release dated January 27, 2010 (sales of new homes).
(2) Calculated internally using estimates of changes in single-family home prices by state, which are weighted using the property values underlying our
single-family mortgage portfolio to obtain a national index. The depreciation rate for each year presented incorporates property value informationon
loans purchased by both Freddie Mac and Fannie Mae, a similarly chartered GSE, through December 31, 2009 and will be subject to change based on
more recent purchase information. Other indices of home prices may have different results, as they are determined using different pools of mortgage
loans and calculated under different conventions than our own.
(3) Source: Inside Mortgage Finance estimates of originations of single-family first-and second liens dated January 29, 2010.
(4) Adjustable-rate mortgage share of the dollar amount of total mortgage applications. Source: Mortgage Bankers Association’s Mortgage Applications
Survey. Data reflect annual average of weekly figures.
(5) Refinance share of the number of conventional mortgage applications. Source: Mortgage Bankers Association’s Mortgage Applications Survey. Data
reflect annual average of weekly figures.
(6) Source: Federal Reserve Flow of Funds Accounts of the United States dated December 10, 2009. The outstanding amounts for 2009 presented above
reflect balances as of September 30, 2009.
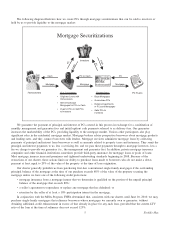
In general terms, the U.S. residential mortgage market consists of a primary mortgage market that links homebuyers and
lenders and a secondary mortgage market that links lenders and investors. In the primary mortgage market, residential
mortgage lenders such as mortgage banking companies, commercial banks, savings institutions, credit unions and other
financial institutions originate or provide mortgages to borrowers. They obtain the funds they lend to mortgage borrowers in
a variety of ways, including by selling mortgages or mortgage-related securities into the secondary mortgage market. Our
charter does not permit us to originate loans in the primary mortgage market.
The secondary mortgage market consists of institutions engaged in buying and selling mortgages in the form of whole
loans (i.e., mortgages that have not been securitized) and mortgage-related securities. We participate in the secondary
mortgage market by purchasing mortgage loans and mortgage-related securities for investment and by issuing guaranteed
mortgage-related securities, principally those we call PCs. We do not lend money directly to homeowners.
4Freddie Mac