Freddie Mac 2009 Annual Report Download - page 11
Download and view the complete annual report
Please find page 11 of the 2009 Freddie Mac annual report below. You can navigate through the pages in the report by either clicking on the pages listed below, or by using the keyword search tool below to find specific information within the annual report.-
 1
1 -
 2
2 -
 3
3 -
 4
4 -
 5
5 -
 6
6 -
 7
7 -
 8
8 -
 9
9 -
 10
10 -
 11
11 -
 12
12 -
 13
13 -
 14
14 -
 15
15 -
 16
16 -
 17
17 -
 18
18 -
 19
19 -
 20
20 -
 21
21 -
 22
22 -
23
-
24
-
25
-
26
-
27
-
28
-
29
-
30
-
31
-
32
-
33
-
34
-
35
-
36
-
37
-
38
-
39
-
40
-
41
-
42
-
43
-
44
-
45
-
46
-
47
-
48
-
49
-
50
-
51
-
52
-
53
-
54
-
55
-
56
-
57
-
58
-
59
-
60
-
61
-
62
-
63
-
64
-
65
-
66
-
67
-
68
-
69
-
70
-
71
-
72
-
73
-
74
-
75
-
76
-
77
-
78
-
79
-
80
-
81
-
82
-
83
-
84
-
85
-
86
-
87
-
88
-
89
-
90
-
91
-
92
-
93
-
94
-
95
-
96
-
97
-
98
-
99
-
100
-
101
-
102
-
103
-
104
-
105
-
106
-
107
-
108
-
109
-
110
-
111
-
112
-
113
-
114
-
115
-
116
-
117
-
118
-
119
-
120
-
121
-
122
-
123
-
124
-
125
-
126
-
127
-
128
-
129
-
130
-
131
-
132
-
133
-
134
-
135
-
136
-
137
-
138
-
139
-
140
-
141
-
142
-
143
-
144
-
145
-
146
-
147
-
148
-
149
-
150
-
151
-
152
-
153
-
154
-
155
-
156
-
157
-
158
-
159
-
160
-
161
-
162
-
163
-
164
-
165
-
166
-
167
-
168
-
169
-
170
-
171
-
172
-
173
-
174
-
175
-
176
-
177
-
178
-
179
-
180
-
181
-
182
-
183
-
184
-
185
-
186
-
187
-
188
-
189
-
190
-
191
-
192
-
193
-
194
-
195
-
196
-
197
-
198
-
199
-
200
-
201
-
202
-
203
-
204
-
205
-
206
-
207
-
208
-
209
-
210
-
211
-
212
-
213
-
214
-
215
-
216
-
217
-
218
-
219
-
220
-
221
-
222
-
223
-
224
-
225
-
226
-
227
-
228
-
229
-
230
-
231
-
232
-
233
-
234
-
235
-
236
-
237
-
238
-
239
-
240
-
241
-
242
-
243
-
244
-
245
-
246
-
247
-
248
-
249
-
250
-
251
-
252
-
253
-
254
-
255
-
256
-
257
-
258
-
259
-
260
-
261
-
262
-
263
-
264
-
265
-
266
-
267
-
268
-
269
-
270
-
271
-
272
-
273
-
274
-
275
-
276
-
277
-
278
-
279
-
280
-
281
-
282
-
283
-
284
-
285
-
286
-
287
-
288
-
289
-
290
-
291
-
292
-
293
-
294
-
295
-
296
-
297
-
298
-
299
-
300
-
301
-
302
-
303
-
304
-
305
-
306
-
307
-
308
-
309
-
310
-
311
-
312
-
313
-
314
-
315
-
316
-
317
-
318
-
319
-
320
-
321
-
322
-
323
-
324
-
325
-
326
-
327
-
328
-
329
-
330
-
331
-
332
-
333
-
334
-
335
-
336
-
337
-
338
-
339
-
340
-
341
-
342
-
343
-
344
-
345
-
346
-
347
 |
 |

2008, and spreads on our debt remained favorable during 2009. We attribute this improvement to the conservatorship and
resulting support we receive from Treasury and the Federal Reserve. Under the amendment to the Purchase Agreement
adopted on December 24, 2009, the $200 billion cap on Treasury’s funding commitment will increase as necessary to
accommodate any cumulative reduction in our net worth during 2010, 2011 and 2012. We believe that this increased support
provided by Treasury will be sufficient to enable us to maintain our access to the debt markets and ensure that we have
adequate liquidity to conduct our normal business activities over the next three years. However, the costs of our debt funding
could vary.
For more information, see “Conservatorship and Related Developments” and “MD&A — LIQUIDITY AND CAPITAL
RESOURCES — Liquidity.”
Risk Management
Our Investments segment has responsibility for managing our interest rate and liquidity risks. We use derivatives to:
(a) regularly adjust or rebalance our funding mix in order to more closely match changes in the interest rate characteristics of
our mortgage-related assets; (b) hedge forecasted issuances of debt; (c) synthetically create callable and non-callable funding;
and (d) hedge foreign-currency exposure. For more information regarding our derivatives, see “QUANTITATIVE AND
QUALITATIVE DISCLOSURES ABOUT MARKET RISK” and “NOTE 13: DERIVATIVES” to our consolidated financial
statements.
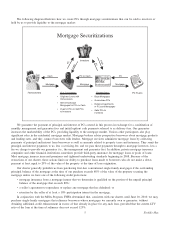
PC and Structured Securities Support Activities
We seek to support the liquidity of the market for our PCs through a variety of activities, including educating dealers
and investors about the merits of trading and investing in PCs, enhancing disclosure related to the collateral underlying our
securities and introducing new mortgage-related securities products and initiatives. We seek to support the price performance
of our PCs through a variety of strategies, including the purchase and sale of PCs and other agency securities, as well as
through the issuance of Structured Securities. As discussed in “Single-Family Guarantee Segment,” our Structured Securities
represent beneficial interests in pools of PCs and certain other types of mortgage-related assets. Our purchases and sales of
mortgage-related securities influence the relative supply and demand for these securities, and the issuance of Structured
Securities helps support the price performance of our PCs. This in turn helps our competitiveness in purchasing mortgages
from our lender customers, many of which we purchase by swapping PCs for the mortgages. Depending upon market
conditions, including the relative prices, supply of and demand for PCs and comparable Fannie Mae securities, as well as
other factors, there may be substantial variability in any period in the total amount of securities we purchase or sell, and in
the success of our efforts to support the liquidity and price performance of our PCs. We may increase, reduce or discontinue
these or other related activities at any time, which could affect the liquidity of the market for PCs. For more information, see
“RISK FACTORS — Competitive and Market Risks — It may be difficult to increase our returns on new single-family
guarantee business.”
Single-Family Guarantee Segment
In our Single-family Guarantee segment, we purchase single-family mortgages originated by our lender customers in the
primary mortgage market, primarily through our guarantor swap program. We securitize the mortgages we purchase and
issue mortgage-related securities that can be sold to investors or held by us in our Investments segment. Earnings for this
segment consist primarily of management and guarantee fee revenues, including amortization of upfront payments we
receive, less related credit costs and operating expenses. Earnings for this segment also include the interest earned on assets
held in the Investments segment related to single-family guarantee activities, net of allocated funding costs and amounts
related to net float benefits. For more information on net float benefits, see “MD&A — CONSOLIDATED RESULTS OF
OPERATIONS — Segment Earnings — Segment Earnings — Results — Single-Family Guarantee.”
Loan and Security Purchases
Our charter establishes requirements for and limitations on the mortgages and mortgage-related securities we may
purchase, as described below. In the Single-family Guarantee segment, we purchase and securitize “single-family mortgages,”
which are mortgages that are secured by one- to four-family properties. A majority of the single-family mortgages we
purchased in 2009 were 30-year and 15-year fixed-rate mortgages.
Our charter places an upper limitation, called the “conforming loan limit,” on the original principal balance of single-
family mortgage loans we purchase. No comparable limits apply to our purchases of multifamily mortgages. The conforming
loan limit is determined annually based on changes in FHFA’s housing price index, a method established and maintained by
FHFA for determining the national average single-family house price. Any decreases in the housing price index are
accumulated and used to offset any future increases in the housing price index so that loan limits do not decrease from year-
to-year. For 2006 to 2009, the base conforming loan limit for a one-family residence was set at $417,000. The base
8Freddie Mac