Experian 2014 Annual Report Download - page 143
Download and view the complete annual report
Please find page 143 of the 2014 Experian annual report below. You can navigate through the pages in the report by either clicking on the pages listed below, or by using the keyword search tool below to find specific information within the annual report.-
 1
1 -
 2
2 -
 3
3 -
 4
4 -
 5
5 -
 6
6 -
 7
7 -
 8
8 -
 9
9 -
 10
10 -
 11
11 -
 12
12 -
 13
13 -
 14
14 -
 15
15 -
 16
16 -
 17
17 -
 18
18 -
 19
19 -
 20
20 -
 21
21 -
 22
22 -
 23
23 -
 24
24 -
 25
25 -
 26
26 -
 27
27 -
 28
28 -
 29
29 -
 30
30 -
 31
31 -
 32
32 -
 33
33 -
 34
34 -
 35
35 -
 36
36 -
 37
37 -
 38
38 -
 39
39 -
 40
40 -
 41
41 -
 42
42 -
 43
43 -
 44
44 -
 45
45 -
 46
46 -
 47
47 -
 48
48 -
 49
49 -
 50
50 -
 51
51 -
 52
52 -
 53
53 -
 54
54 -
 55
55 -
 56
56 -
 57
57 -
 58
58 -
 59
59 -
 60
60 -
 61
61 -
 62
62 -
 63
63 -
 64
64 -
 65
65 -
 66
66 -
 67
67 -
 68
68 -
 69
69 -
 70
70 -
 71
71 -
 72
72 -
 73
73 -
 74
74 -
 75
75 -
 76
76 -
 77
77 -
 78
78 -
 79
79 -
 80
80 -
 81
81 -
 82
82 -
 83
83 -
 84
84 -
 85
85 -
 86
86 -
 87
87 -
 88
88 -
 89
89 -
 90
90 -
 91
91 -
 92
92 -
 93
93 -
 94
94 -
 95
95 -
 96
96 -
 97
97 -
 98
98 -
 99
99 -
 100
100 -
 101
101 -
 102
102 -
 103
103 -
 104
104 -
 105
105 -
 106
106 -
 107
107 -
 108
108 -
 109
109 -
 110
110 -
 111
111 -
 112
112 -
 113
113 -
 114
114 -
 115
115 -
 116
116 -
 117
117 -
 118
118 -
 119
119 -
 120
120 -
 121
121 -
 122
122 -
 123
123 -
 124
124 -
 125
125 -
 126
126 -
 127
127 -
 128
128 -
 129
129 -
 130
130 -
 131
131 -
 132
132 -
 133
133 -
 134
134 -
 135
135 -
 136
136 -
 137
137 -
 138
138 -
 139
139 -
 140
140 -
 141
141 -
 142
142 -
 143
143 -
 144
144 -
 145
145 -
 146
146 -
 147
147 -
 148
148 -
 149
149 -
 150
150 -
 151
151 -
 152
152 -
 153
153 -
 154
154 -
 155
155 -
 156
156 -
 157
157 -
 158
158 -
 159
159 -
 160
160 -
 161
161 -
 162
162 -
 163
163 -
 164
164 -
 165
165 -
 166
166 -
 167
167 -
 168
168 -
 169
169 -
 170
170 -
 171
171 -
 172
172 -
 173
173 -
 174
174 -
 175
175 -
 176
176 -
 177
177 -
 178
178
 |
 |

Financial statements • Notes to the Group financial statements 139
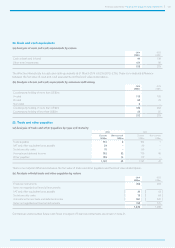
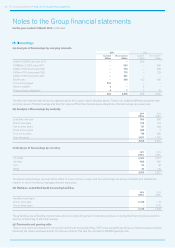
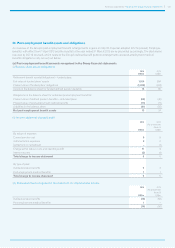
24. Cash and cash equivalents
(a) Analysis of cash and cash equivalents by nature
2014
US$m
2013
US$m
Cash at bank and in hand 91 139
Short-term investments 121 90
212 229
The effective interest rate for cash and cash equivalents at 31 March 2014 is 6.2% (2013: 3.7%). There is no material difference
between the fair value of cash and cash equivalents and the book value stated above.
(b) Analysis of cash and cash equivalents by external credit rating
2014
US$m
2013
US$m
Counterparty holding of more than US$2m:
A rated 113 125
B rated 68 79
Non-rated 8 –
Counterparty holding of more than US$2m 189 204
Counterparty holding of less than US$2m 23 25
212 229
25. Trade and other payables
(a) Analysis of trade and other payables by type and maturity
2014 2013
Current
US$m
Non-current
US$m
Current
US$m
Non-current
US$m
Trade payables 153 6 184 1
VAT and other equivalent taxes payable 39 – 43 –
Social security costs 78 – 85 –
Accruals and deferred income 792 32 773 40
Other payables 106 14 112 –
1,168 52 1,197 41
There is no material difference between the fair value of trade and other payables and the book value stated above.
(b) Analysis of total trade and other payables by nature
2014
US$m
2013
US$m
Financial instruments 452 463
Items not regarded as financial instruments:
VAT and other equivalent taxes payable 39 43
Social security costs 78 85
Amounts within accruals and deferred income 651 647
Items not regarded as financial instruments 768 775
1,220 1,238
Contractual undiscounted future cash flows in respect of financial instruments are shown in note 31.
