Experian 2014 Annual Report Download - page 132
Download and view the complete annual report
Please find page 132 of the 2014 Experian annual report below. You can navigate through the pages in the report by either clicking on the pages listed below, or by using the keyword search tool below to find specific information within the annual report.-
 1
1 -
2
-
3
-
4
-
5
-
6
-
7
-
8
-
9
-
10
-
11
-
12
-
13
-
14
-
15
-
16
-
17
-
18
-
19
-
20
-
21
-
22
-
23
-
24
-
25
-
26
-
27
-
28
-
29
-
30
-
31
-
32
-
33
-
34
-
35
-
36
-
37
-
38
-
39
-
40
-
41
-
42
-
43
-
44
-
45
-
46
-
47
-
48
-
49
-
50
-
51
-
52
-
53
-
54
-
55
-
56
-
57
-
58
-
59
-
60
-
61
-
62
-
63
-
64
-
65
-
66
-
67
-
68
-
69
-
70
-
71
-
72
-
73
-
74
-
75
-
76
-
77
-
78
-
79
-
80
-
81
-
82
-
83
-
84
-
85
-
86
-
87
-
88
-
89
-
90
-
91
-
92
-
93
-
94
-
95
-
96
-
97
-
98
-
99
-
100
-
101
-
102
-
103
-
104
-
105
-
106
-
107
-
108
-
109
-
110
-
111
-
112
-
113
-
114
-
115
-
116
-
117
-
118
-
119
-
120
-
121
-
 122
122 -
 123
123 -
 124
124 -
 125
125 -
 126
126 -
 127
127 -
 128
128 -
 129
129 -
 130
130 -
 131
131 -
 132
132 -
 133
133 -
 134
134 -
 135
135 -
 136
136 -
 137
137 -
 138
138 -
 139
139 -
 140
140 -
 141
141 -
 142
142 -
143
-
144
-
145
-
146
-
147
-
148
-
149
-
150
-
151
-
152
-
153
-
154
-
155
-
156
-
157
-
158
-
159
-
160
-
161
-
162
-
163
-
164
-
165
-
166
-
167
-
168
-
169
-
170
-
171
-
172
-
173
-
174
-
175
-
176
-
177
-
178
 |
 |

Financial statements • Notes to the Group financial statements
Notes to the Group financial statements
for the year ended 31 March 2014 continued
128
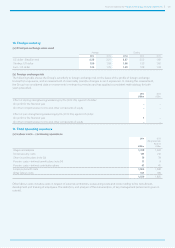
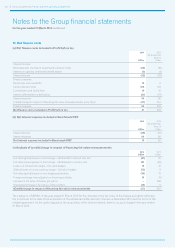
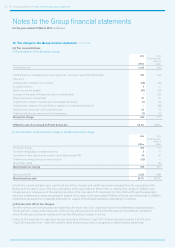
15. Net finance costs
(a) Net finance costs included in Profit before tax
2014
US$m
2013
(Re-presented)
(Note 3)
US$m
Interest income:
Bank deposits, short-term investments and loan notes (20) (16)
Interest on opening retirement benefit assets (2) (4)
Interest income (22) (20)
Finance expense:
Bank loans and overdrafts 14 6
Eurobonds and notes 103 103
Commitment and facility fees 10 10
Interest differentials on derivatives (31) (37)
Interest expense 96 82
(Credit)/charge in respect of financing fair value remeasurements (note 15(c)) (27) 561
Finance expense 69 643
Net finance costs included in Profit before tax 47 623
(b) Net interest expense included in Benchmark PBT
2014
US$m
2013
(Re-presented)
(Note 3)
US$m
Interest income (22) (20)
Interest expense 96 82
Net interest expense included in Benchmark PBT 74 62
(c) Analysis of (credit)/charge in respect of financing fair value remeasurements
2014
US$m
2013
US$m
Fair value (gains)/losses on borrowings – attributable to interest rate risk (61) 32
Fair value losses/(gains) on borrowings – attributable to currency risk 121 (60)
Losses on interest rate swaps – fair value hedges 15 12
(Gains)/losses on cross currency swaps – fair value hedges (73) 9
Fair value (gains)/losses on non-hedging derivatives (36) 10
Foreign exchange losses/(gains) on financing activities 19 (5)
Increase in fair value of Serasa put option – 558
(Decrease)/increase in fair value of other options (12) 5
(Credit)/charge in respect of financing fair value remeasurements (27) 561
The charge of US$558m in the year ended 31 March 2013 for the increase in the fair value of the Serasa put option reflected
the movement to the date of the acquisition of the additional 29.6% interest in Serasa in November 2012 and the terms of the
related agreement. As the option lapsed on the acquisition of the further interest, there is no such charge in the year ended
31 March 2014.