Experian 2014 Annual Report Download - page 129
Download and view the complete annual report
Please find page 129 of the 2014 Experian annual report below. You can navigate through the pages in the report by either clicking on the pages listed below, or by using the keyword search tool below to find specific information within the annual report.-
 1
1 -
2
-
3
-
4
-
5
-
6
-
7
-
8
-
9
-
10
-
11
-
12
-
13
-
14
-
15
-
16
-
17
-
18
-
19
-
20
-
21
-
22
-
23
-
24
-
25
-
26
-
27
-
28
-
29
-
30
-
31
-
32
-
33
-
34
-
35
-
36
-
37
-
38
-
39
-
40
-
41
-
42
-
43
-
44
-
45
-
46
-
47
-
48
-
49
-
50
-
51
-
52
-
53
-
54
-
55
-
56
-
57
-
58
-
59
-
60
-
61
-
62
-
63
-
64
-
65
-
66
-
67
-
68
-
69
-
70
-
71
-
72
-
73
-
74
-
75
-
76
-
77
-
78
-
79
-
80
-
81
-
82
-
83
-
84
-
85
-
86
-
87
-
88
-
89
-
90
-
91
-
92
-
93
-
94
-
95
-
96
-
97
-
98
-
99
-
100
-
101
-
102
-
103
-
104
-
105
-
106
-
107
-
108
-
109
-
110
-
111
-
112
-
113
-
114
-
115
-
116
-
117
-
118
-
 119
119 -
 120
120 -
 121
121 -
 122
122 -
 123
123 -
 124
124 -
 125
125 -
 126
126 -
 127
127 -
 128
128 -
 129
129 -
 130
130 -
 131
131 -
 132
132 -
 133
133 -
 134
134 -
 135
135 -
 136
136 -
 137
137 -
 138
138 -
 139
139 -
140
-
141
-
142
-
143
-
144
-
145
-
146
-
147
-
148
-
149
-
150
-
151
-
152
-
153
-
154
-
155
-
156
-
157
-
158
-
159
-
160
-
161
-
162
-
163
-
164
-
165
-
166
-
167
-
168
-
169
-
170
-
171
-
172
-
173
-
174
-
175
-
176
-
177
-
178
 |
 |

Financial statements • Notes to the Group financial statements 125
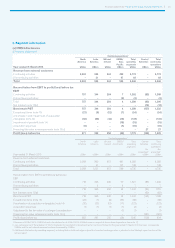
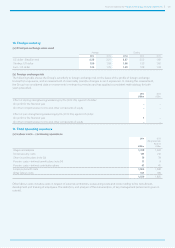
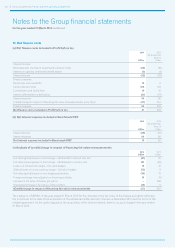
10. Foreign currency
(a) Principal exchange rates used
Average Closing
2014 2013 2014 2013 2012
US dollar : Brazilian real 2.25 2.01 2.27 2.02 1.82
Sterling : US dollar 1.59 1.58 1.66 1.52 1.60
Euro : US dollar 1.34 1.29 1.38 1.28 1.33
(b) Foreign exchange risk
The following table shows the Group’s sensitivity to foreign exchange risk on the basis of the profile of foreign exchange
transaction exposures, and an assessment of reasonably possible changes in such exposures. In making this assessment,
the Group has considered data on movements in relevant currencies and has applied a consistent methodology for both
years presented.
2014
US$m
2013
US$m
Effect of sterling strengthening/weakening by 2% (2013: 3%) against US dollar:
On profit for the financial year – –
On other comprehensive income and other components of equity – –
Effect of euro strengthening/weakening by 5% (2013: 6%) against US dollar:
On profit for the financial year 1 –
On other comprehensive income and other components of equity – –
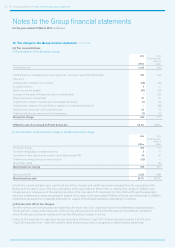
11. Total operating expenses
(a) Labour costs – continuing operations
2014
US$m
2013
(Re-presented)
(Note 3)
US$m
Wages and salaries 1,338 1,302
Social security costs 191 212
Share incentive plans (note 32) 76 78
Pension costs – defined benefit plans (note 34) 11 9
Pension costs – defined contribution plans 47 45
Employee benefit costs 1,663 1,646
Other labour costs 167 189
1,830 1,835
Other labour costs includes costs in respect of external contractors, outsourcing costs and costs relating to the recruitment,
development and training of employees. The definition, and analysis of the remuneration, of key management personnel is given in
note 46.