Electronic Arts 2002 Annual Report Download - page 17
Download and view the complete annual report
Please find page 17 of the 2002 Electronic Arts annual report below. You can navigate through the pages in the report by either clicking on the pages listed below, or by using the keyword search tool below to find specific information within the annual report.-
 1
1 -
2
-
3
-
4
-
5
-
6
-
 7
7 -
 8
8 -
 9
9 -
 10
10 -
 11
11 -
 12
12 -
 13
13 -
 14
14 -
 15
15 -
 16
16 -
 17
17 -
 18
18 -
 19
19 -
 20
20 -
 21
21 -
 22
22 -
 23
23 -
 24
24 -
 25
25 -
 26
26 -
 27
27 -
28
-
29
-
30
-
31
-
32
-
33
-
34
-
35
-
36
-
37
-
38
-
39
-
40
-
41
-
42
-
43
-
44
-
45
-
46
-
47
-
48
-
49
-
50
-
51
-
52
-
53
-
54
-
55
-
56
-
57
-
58
-
59
-
60
-
61
-
62
-
63
-
64
-
65
-
66
-
67
-
68
-
69
-
70
-
71
-
72
-
73
-
74
 |
 |

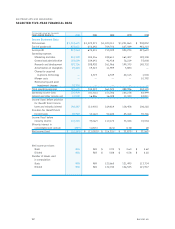
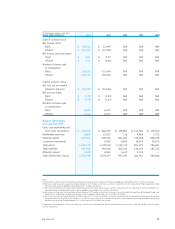
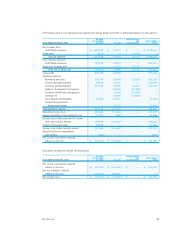
(In thousands, except per share data)
YEARS ENDED MARCH 31, 2002 2001 2000 1999 1998
Class A common stock:
Net income (loss):
Basic $124,256 $11,944 N/A N/A N/A
Diluted $101,509 $(11,082) N/A N/A N/A
Net income (loss) per share:
Basic $0.91 $0.09 N/A N/A N/A
Diluted $0.71 $(0.08) N/A N/A N/A
Number of shares used
in computation:
Basic 136,832 131,404 N/A N/A N/A
Diluted 143,142 132,056 N/A N/A N/A
Class B common stock:
Net loss, net of retained
interest in EA.com $(22,747) $(23,026) N/A N/A N/A
Net loss per share:
Basic $(3.77) $(3.83) N/A N/A N/A
Diluted $(3.77) $(3.83) N/A N/A N/A
Number of shares used
in computation:
Basic 6,026 6,015 N/A N/A N/A
Diluted 6,026 6,015 N/A N/A N/A
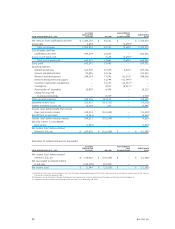
Balance Sheet Data
at Fiscal Year End
Cash, cash equivalents and
short-term investments $796,936 $466,492 $ 339,804 $ 312,822 $ 374,560
Marketable securities 6,869 10,022 236 4,884 3,721
Working capital 699,561 478,701 440,021 333,256 408,098
Long-term investments —8,400 8,400 18,400 24,200
Total assets 1,699,374 1,378,918 1,192,312 901,873 745,681
Total liabilities 452,982 340,026 265,302 236,209 181,713
Minority interest 3,098 4,545 3,617 2,733 —
Total stockholders’ equity 1,243,294 1,034,347 923,393 662,931 563,968
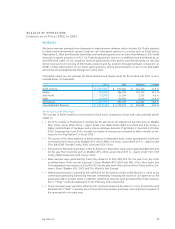
Note:
(a) Net income includes restructuring and asset impairment charges of $14.0 million, net of taxes and goodwill amortization of $17.5 million, net of taxes.
(b) Net loss includes one-time acquisition related charges of $1.9 million, net of taxes, incurred in connection with the acquisition of Pogo Corporation made
during the year as well as goodwill amortization of $13.3 million, net of taxes.
(c) Net income includes one-time acquisition related charges of $4.5 million, net of taxes, incurred in connection with the acquisition of Kesmai and other busi-
ness combinations made during the year as well as goodwill amortization of $8.3 million, net of taxes.
(d) Net income includes one-time acquisition related charges of $37.5 million, net of taxes, incurred in connection with the acquisition of Westwood Studios and
other business combinations made during the year as well as goodwill amortization of $4.0 million, net of taxes.
(e) Net income includes one-time acquisition related charges of $1.0 million, net of taxes, incurred in connection with the acquisition of the remaining minority
ownership interest in Electronic Arts Victor, Inc. as well as merger costs of $7.2 million, net of taxes, associated with the merger with Maxis, offset by a
one-time gain on sale of Creative Wonders, LLC in the amount of $8.5 million, net of taxes.
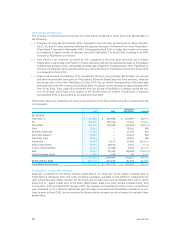
Please refer to Management’s Discussion and Analysis of Financial Condition and Results of Operations for discussions of EA Core and EA.com pro forma
financial statements.
EA 2002 AR 13