Dish Network 2010 Annual Report Download - page 63
Download and view the complete annual report
Please find page 63 of the 2010 Dish Network annual report below. You can navigate through the pages in the report by either clicking on the pages listed below, or by using the keyword search tool below to find specific information within the annual report.-
 1
1 -
2
-
3
-
4
-
5
-
6
-
7
-
8
-
9
-
10
-
11
-
12
-
13
-
14
-
15
-
16
-
17
-
18
-
19
-
20
-
21
-
22
-
23
-
24
-
25
-
26
-
27
-
28
-
29
-
30
-
31
-
32
-
33
-
34
-
35
-
36
-
37
-
38
-
39
-
40
-
41
-
42
-
43
-
44
-
45
-
46
-
47
-
48
-
49
-
50
-
51
-
52
-
 53
53 -
 54
54 -
 55
55 -
 56
56 -
 57
57 -
 58
58 -
 59
59 -
 60
60 -
 61
61 -
 62
62 -
 63
63 -
 64
64 -
 65
65 -
 66
66 -
 67
67 -
 68
68 -
 69
69 -
 70
70 -
 71
71 -
 72
72 -
 73
73 -
74
-
75
-
76
-
77
-
78
-
79
-
80
-
81
-
82
-
83
-
84
-
85
-
86
-
87
-
88
-
89
-
90
-
91
-
92
-
93
-
94
-
95
-
96
-
97
-
98
-
99
-
100
-
101
-
102
-
103
-
104
-
105
-
106
-
107
-
108
-
109
-
110
-
111
-
112
-
113
-
114
-
115
-
116
-
117
-
118
-
119
-
120
-
121
-
122
-
123
-
124
-
125
-
126
-
127
-
128
-
129
-
130
-
131
-
132
-
133
-
134
-
135
-
136
-
137
-
138
-
139
-
140
-
141
-
142
-
143
-
144
-
145
-
146
-
147
-
148
 |
 |

Item 7. MANAGEMENT’S DISCUSSION AND ANALYSIS OF FINANCIAL CONDITION AND
RESULTS OF OPERATIONS - Continued
56
56
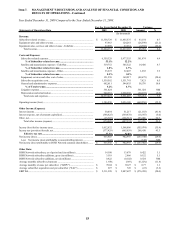
Interest expense, net of amounts capitalized. “Interest expense, net of amounts capitalized” totaled $388 million
during the year ended December 31, 2009, an increase of $19 million or 5.0% compared to the same period in 2008.
This change primarily resulted from an increase in interest expense related to the issuance of debt during 2009 and
2008 and the Ciel II capital lease, partially offset by a decrease in interest expense associated with 2008 debt
redemptions.
Other, net. “Other, net” expense totaled $16 million during the year ended December 31, 2009 compared to $169
million in 2008, a decrease of $153 million. This decrease primarily resulted from $178 million less in impairment
charges on marketable and other investment securities, partially offset by $33 million less in net gains on the sale and
exchanges of investments in 2009 compared to 2008.
Earnings before interest, taxes, depreciation and amortization. EBITDA was $2.311 billion during the year ended
December 31, 2009, a decrease of $576 million or 20.0% compared to the same period in 2008. EBITDA for the year
ended December 31, 2009 was negatively impacted by the $361 million “Litigation expense.” The following table
reconciles EBITDA to the accompanying financial statements.
2009 2008
EBITDA......................................................................................................... 2,311,398$ 2,887,697$
Interest expense, net ..................................................................................... (358,391) (318,661)
Income tax (provision) benefit, net............................................................... (377,429) (665,859)
Depreciation and amortization...................................................................... (940,033) (1,000,230)
Net income (loss) attributable to DISH Network common shareholders........ 635,545$ 902,947$
For the Years Ended
December 31,
(In thousands)
EBITDA is not a measure determined in accordance with accounting principles generally accepted in the United
States, or GAAP, and should not be considered a substitute for operating income, net income or any other measure
determined in accordance with GAAP. EBITDA is used as a measurement of operating efficiency and overall
financial performance and we believe it to be a helpful measure for those evaluating companies in the pay-TV
industry. Conceptually, EBITDA measures the amount of income generated each period that could be used to
service debt, pay taxes and fund capital expenditures. EBITDA should not be considered in isolation or as a substitute
for measures of performance prepared in accordance with GAAP.
Income tax (provision) benefit, net. Our income tax provision was $377 million during the year ended December
31, 2009, a decrease of $288 million compared to the same period in 2008. The decrease in the provision was
primarily related to the decrease in “Income (loss) before income taxes” and a decrease in our effective tax rate.
During the year ended December 31, 2008, our effective tax rate was negatively impacted by the establishment of an
$80 million valuation allowance against deferred tax assets, which are capital in nature.
Net income (loss) attributable to DISH Network common shareholders. “Net income (loss) attributable to DISH
Network common shareholders” was $636 million during the year ended December 31, 2009, a decrease of $267
million compared to $903 million for the same period in 2008. The decrease was primarily attributable to the
changes in revenue and expenses discussed above.