Dish Network 2010 Annual Report Download - page 59
Download and view the complete annual report
Please find page 59 of the 2010 Dish Network annual report below. You can navigate through the pages in the report by either clicking on the pages listed below, or by using the keyword search tool below to find specific information within the annual report.-
 1
1 -
2
-
3
-
4
-
5
-
6
-
7
-
8
-
9
-
10
-
11
-
12
-
13
-
14
-
15
-
16
-
17
-
18
-
19
-
20
-
21
-
22
-
23
-
24
-
25
-
26
-
27
-
28
-
29
-
30
-
31
-
32
-
33
-
34
-
35
-
36
-
37
-
38
-
39
-
40
-
41
-
42
-
43
-
44
-
45
-
46
-
47
-
48
-
 49
49 -
 50
50 -
 51
51 -
 52
52 -
 53
53 -
 54
54 -
 55
55 -
 56
56 -
 57
57 -
 58
58 -
 59
59 -
 60
60 -
 61
61 -
 62
62 -
 63
63 -
 64
64 -
 65
65 -
 66
66 -
 67
67 -
 68
68 -
 69
69 -
70
-
71
-
72
-
73
-
74
-
75
-
76
-
77
-
78
-
79
-
80
-
81
-
82
-
83
-
84
-
85
-
86
-
87
-
88
-
89
-
90
-
91
-
92
-
93
-
94
-
95
-
96
-
97
-
98
-
99
-
100
-
101
-
102
-
103
-
104
-
105
-
106
-
107
-
108
-
109
-
110
-
111
-
112
-
113
-
114
-
115
-
116
-
117
-
118
-
119
-
120
-
121
-
122
-
123
-
124
-
125
-
126
-
127
-
128
-
129
-
130
-
131
-
132
-
133
-
134
-
135
-
136
-
137
-
138
-
139
-
140
-
141
-
142
-
143
-
144
-
145
-
146
-
147
-
148
 |
 |

Item 7. MANAGEMENT’S DISCUSSION AND ANALYSIS OF FINANCIAL CONDITION AND
RESULTS OF OPERATIONS - Continued
52
52
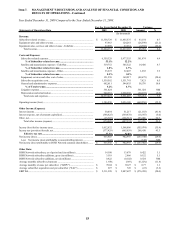
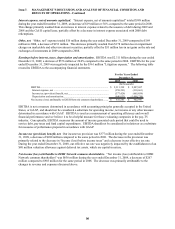
Earnings before interest, taxes, depreciation and amortization. EBITDA was $2.956 billion during the year ended
December 31, 2010, an increase of $644 million or 27.9% compared to the same period in 2009. The following table
reconciles EBITDA to the accompanying financial statements.
2010 2009
EBITDA......................................................................................................... 2,955,786$ 2,311,398$
Interest expense, net ..................................................................................... (429,619) (358,391)
Income tax (provision) benefit, net............................................................... (557,473) (377,429)
Depreciation and amortization...................................................................... (983,965) (940,033)
Net income (loss) attributable to DISH Network common shareholders........ 984,729$ 635,545$
For the Years Ended
December 31,
(In thousands)
EBITDA is not a measure determined in accordance with accounting principles generally accepted in the United
States, or GAAP, and should not be considered a substitute for operating income, net income or any other measure
determined in accordance with GAAP. EBITDA is used as a measurement of operating efficiency and overall
financial performance and we believe it to be a helpful measure for those evaluating companies in the pay-TV
industry. Conceptually, EBITDA measures the amount of income generated each period that could be used to
service debt, pay taxes and fund capital expenditures. EBITDA should not be considered in isolation or as a substitute
for measures of performance prepared in accordance with GAAP.
Income tax (provision) benefit, net. Our income tax provision was $557 million during the year ended December
31, 2010, an increase of $180 million compared to the same period in 2009. The increase in the provision was
primarily related to the increase in “Income (loss) before income taxes.”
Net income (loss) attributable to DISH Network common shareholders. “Net income (loss) attributable to DISH
Network common shareholders” was $985 million during the year ended December 31, 2010, an increase of $349
million compared to $636 million for the same period in 2009. The increase was primarily attributable to the
changes in revenue and expenses discussed above.