Dish Network 2010 Annual Report Download - page 106
Download and view the complete annual report
Please find page 106 of the 2010 Dish Network annual report below. You can navigate through the pages in the report by either clicking on the pages listed below, or by using the keyword search tool below to find specific information within the annual report.-
 1
1 -
2
-
3
-
4
-
5
-
6
-
7
-
8
-
9
-
10
-
11
-
12
-
13
-
14
-
15
-
16
-
17
-
18
-
19
-
20
-
21
-
22
-
23
-
24
-
25
-
26
-
27
-
28
-
29
-
30
-
31
-
32
-
33
-
34
-
35
-
36
-
37
-
38
-
39
-
40
-
41
-
42
-
43
-
44
-
45
-
46
-
47
-
48
-
49
-
50
-
51
-
52
-
53
-
54
-
55
-
56
-
57
-
58
-
59
-
60
-
61
-
62
-
63
-
64
-
65
-
66
-
67
-
68
-
69
-
70
-
71
-
72
-
73
-
74
-
75
-
76
-
77
-
78
-
79
-
80
-
81
-
82
-
83
-
84
-
85
-
86
-
87
-
88
-
89
-
90
-
91
-
92
-
93
-
94
-
95
-
 96
96 -
 97
97 -
 98
98 -
 99
99 -
 100
100 -
 101
101 -
 102
102 -
 103
103 -
 104
104 -
 105
105 -
 106
106 -
 107
107 -
 108
108 -
 109
109 -
 110
110 -
 111
111 -
 112
112 -
 113
113 -
 114
114 -
 115
115 -
 116
116 -
117
-
118
-
119
-
120
-
121
-
122
-
123
-
124
-
125
-
126
-
127
-
128
-
129
-
130
-
131
-
132
-
133
-
134
-
135
-
136
-
137
-
138
-
139
-
140
-
141
-
142
-
143
-
144
-
145
-
146
-
147
-
148
 |
 |

DISH NETWORK CORPORATION
NOTES TO CONSOLIDATED FINANCIAL STATEMENTS - Continued
F-21
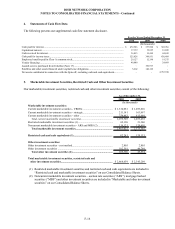
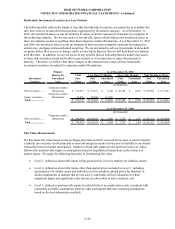
Our assets measured at fair value on a recurring basis were as follows:
Total Level 1 Level 2 Level 3 Total Level 1 Level 2 Level 3
(In thousands)
Debt securities:
VRDNs........................................................ 1,334,081$ -$ 1,334,081$ -$ 1,053,826$ -$ 1,053,826$ -$
ARS and MBS............................................. 119,121 - 6,031 113,090 120,650 - 7,907 112,743
Other (including restricted)........................ 888,621 21,835 810,883 55,903 917,069 22,031 894,770 268
Equity securities............................................ 195,022 195,022 - - 83,957 83,957 - -
Subtotal.......................................................... 2,536,845 216,857$ 2,150,995$ 168,993$ 2,175,502$ 105,988$ 1,956,503$ 113,011$
Less certain other investment securities ..... (55,823)
Total marketable investment securities....... 2,481,022$
As of
December 31, 2010 December 31, 2009
Changes in Level 3 instruments are as follows:
Level 3
Investment
Securities
(In thousands)
Balance as of December 31, 2009............................................................................................... 113,011$
Net realized and unrealized gains (losses) included in earnings................................................... 6,732
Net realized and unrealized gains (losses) included in earnings - fair value election.................... (49,656)
Net realized and unrealized gains (losses) included in other comprehensive income (loss)......... 55,308
Purchases, issuances and settlements, net .................................................................................... (4,085)
Transfers from level 2 to level 3................................................................................................... 47,683
Balance as of December 31, 2010............................................................................................... 168,993$
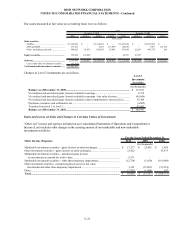
Gains and Losses on Sales and Changes in Carrying Values of Investments
“Other, net” income and expense included on our Consolidated Statements of Operations and Comprehensive
Income (Loss) includes other changes in the carrying amount of our marketable and non-marketable
investments as follows:
Other Income (Expense): 2010 2009 2008
Marketable investment securities - gains (losses) on sales/exchanges.................................. $ 13,277 $ 23,042 $ 2,095
Other investment securities - gains (losses) on sales/exchanges........................................... 21,422 - 53,473
Marketable investment securities - unrealized gains (losses)
on investments accounted for at fair value....................................................................... 8,371 - -
Marketable investment securities - other-than-temporary impairments................................ (12,734) (1,050) (191,404)
Other investment securities - unrealized gains (losses) on fair value
investments and other-than-temporary impairments ........................................................ 3,361 (35,803) (33,534)
Other..................................................................................................................................... (2,701) (1,896) 657
Total..................................................................................................................................... 30,996$ (15,707)$ (168,713)$
For the Years Ended December 31,
(In thousands)