Dish Network 2010 Annual Report Download - page 101
Download and view the complete annual report
Please find page 101 of the 2010 Dish Network annual report below. You can navigate through the pages in the report by either clicking on the pages listed below, or by using the keyword search tool below to find specific information within the annual report.-
 1
1 -
2
-
3
-
4
-
5
-
6
-
7
-
8
-
9
-
10
-
11
-
12
-
13
-
14
-
15
-
16
-
17
-
18
-
19
-
20
-
21
-
22
-
23
-
24
-
25
-
26
-
27
-
28
-
29
-
30
-
31
-
32
-
33
-
34
-
35
-
36
-
37
-
38
-
39
-
40
-
41
-
42
-
43
-
44
-
45
-
46
-
47
-
48
-
49
-
50
-
51
-
52
-
53
-
54
-
55
-
56
-
57
-
58
-
59
-
60
-
61
-
62
-
63
-
64
-
65
-
66
-
67
-
68
-
69
-
70
-
71
-
72
-
73
-
74
-
75
-
76
-
77
-
78
-
79
-
80
-
81
-
82
-
83
-
84
-
85
-
86
-
87
-
88
-
89
-
90
-
 91
91 -
 92
92 -
 93
93 -
 94
94 -
 95
95 -
 96
96 -
 97
97 -
 98
98 -
 99
99 -
 100
100 -
 101
101 -
 102
102 -
 103
103 -
 104
104 -
 105
105 -
 106
106 -
 107
107 -
 108
108 -
 109
109 -
 110
110 -
 111
111 -
112
-
113
-
114
-
115
-
116
-
117
-
118
-
119
-
120
-
121
-
122
-
123
-
124
-
125
-
126
-
127
-
128
-
129
-
130
-
131
-
132
-
133
-
134
-
135
-
136
-
137
-
138
-
139
-
140
-
141
-
142
-
143
-
144
-
145
-
146
-
147
-
148
 |
 |

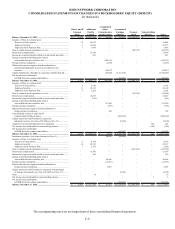
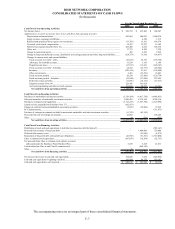
DISH NETWORK CORPORATION
NOTES TO CONSOLIDATED FINANCIAL STATEMENTS - Continued
F-16
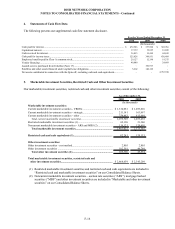
4. Statements of Cash Flow Data
The following presents our supplemental cash flow statement disclosure.
201020092008
Cash paid for interest.............................................................................................................................
$ 472,586 $ 357,990 $ 385,936
Capitalized interest................................................................................................................................
17,139 19,685 16,880
Cash received for interest......................................................................................................................
36,853 19,489 44,843
Cash paid for income taxes....................................................................................................................
525,028 348,931 430,408
Employee benefits paid in Class A common stock................................................................................
29,127 12,198 19,375
Vendor financing ..................................................................................................................................
40,000 - 24,469
Launch service purchased from EchoStar (Note 17).............................................................................
- 102,913 -
Satellites and other assets financed under capital lease obligations.......................................................
5,282 140,109 -
Net assets contributed in connection with the Spin-off, excluding cash and cash equivalents..............
- - 2,765,398
For the Years Ended December 31,
(In thousands)
5. Marketable Investment Securities, Restricted Cash and Other Investment Securities
Our marketable investment securities, restricted cash and other investment securities consist of the following:
As of December 31,
2010 2009
(In thousands)
Marketable investment securities:
Current marketable investment securities - VRDNs ............................................ 1,334,081$ 1,053,826$
Current marketable investment securities - strategic............................................. 211,141 163,997
Current marketable investment securities - other ................................................. 754,483 815,669
Total current marketable investment securities.............................................. 2,299,705 2,033,492
Restricted marketable investment securities (1).................................................... 62,196 21,360
Noncurrent marketable investment securities - ARS and MBS (2)....................... 119,121 120,650
Total marketable investment securities....................................................... 2,481,022 2,175,502
Restricted cash and cash equivalents (1).......................................................... 82,241 120,133
Other investment securities:
Other investment securities - cost method............................................................ 2,805 2,805
Other investment securities .................................................................................. 102,591 46,769
Total other investment securities (2)............................................................ 105,396 49,574
Total marketable investment securities, restricted cash and
other investment securities............................................................................. 2,668,659$ 2,345,209$
(1) Restricted marketable investment securities and restricted cash and cash equivalents are included in
“Restricted cash and marketable investment securities” on our Consolidated Balance Sheets.
(2) Noncurrent marketable investment securities – auction rate securities (“ARS”), mortgage backed
securities (“MBS”) and other investment securities are included in “Marketable and other investment
securities” on our Consolidated Balance Sheets.