Dillard's 2009 Annual Report Download - page 76
Download and view the complete annual report
Please find page 76 of the 2009 Dillard's annual report below. You can navigate through the pages in the report by either clicking on the pages listed below, or by using the keyword search tool below to find specific information within the annual report.-
 1
1 -
2
-
3
-
4
-
5
-
6
-
7
-
8
-
9
-
10
-
11
-
12
-
13
-
14
-
15
-
16
-
17
-
18
-
19
-
20
-
21
-
22
-
23
-
24
-
25
-
26
-
27
-
28
-
29
-
30
-
31
-
32
-
33
-
34
-
35
-
36
-
37
-
38
-
39
-
40
-
41
-
42
-
43
-
44
-
45
-
46
-
47
-
48
-
49
-
50
-
51
-
52
-
53
-
54
-
55
-
56
-
57
-
58
-
59
-
60
-
61
-
62
-
63
-
64
-
65
-
 66
66 -
 67
67 -
 68
68 -
 69
69 -
 70
70 -
 71
71 -
 72
72 -
 73
73 -
 74
74 -
 75
75 -
 76
76 -
 77
77 -
 78
78 -
 79
79 -
 80
80 -
 81
81 -
 82
82
 |
 |

NOTES TO CONSOLIDATED FINANCIAL STATEMENTS (Continued)
17. Fair Value Disclosures (Continued)
January 30, 2010 and January 31, 2009 was $150 million and $48 million, respectively. The carrying
value of the subordinated debentures at January 30, 2010 and January 31, 2009 was $200 million.
Assets and Liabilities Measured at Fair Value on a Nonrecurring Basis
The FASB’s accounting guidance utilizes a fair value hierarchy that prioritizes the inputs to the
valuation techniques used to measure fair value into three broad levels:
• Level 1: Observable inputs such as quoted prices (unadjusted) in active markets for identical
assets or liabilities
• Level 2: Inputs, other than quoted prices, that are observable for the asset or liability, either
directly or indirectly; these include quoted prices for similar assets or liabilities in active markets
and quoted prices for identical or similar assets or liabilities in markets that are not active
• Level 3: Unobservable inputs that reflect the reporting entity’s own assumptions
Basis of Fair Value Measurements
Quoted Prices Significant
In Active Other Significant
Fair Value Markets for Observable Unobservable
of Assets Identical Items Inputs Inputs
(in thousands) (Liabilities) (Level 1) (Level 2) (Level 3)
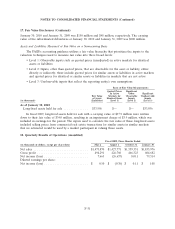
As of January 30, 2010
Long-lived assets held for sale .............. $33,956 $— $— $33,956
In fiscal 2009, long-lived assets held for sale with a carrying value of $37.9 million were written
down to their fair value of $34.0 million, resulting in an impairment charge of $3.9 million, which was
included in earnings for the period. The inputs used to calculate the fair value of these long-lived assets
included selling prices from commercial real estate transactions for similar assets in similar markets
that we estimated would be used by a market participant in valuing these assets.
18. Quarterly Results of Operations (unaudited)
Fiscal 2009, Three Months Ended
(in thousands of dollars, except per share data) May 2 August 1 October 31 January 30
Net sales ............................... $1,473,870 $1,427,771 $1,359,331 $1,833,976
Gross profit ............................. 494,291 426,760 466,323 604,682
Net income (loss) ......................... 7,663 (26,657) 8,011 79,514
Diluted earnings per share:
Net income (loss) ......................... $ 0.10 $ (0.36) $ 0.11 $ 1.08
F-31