Dillard's 2009 Annual Report Download - page 75
Download and view the complete annual report
Please find page 75 of the 2009 Dillard's annual report below. You can navigate through the pages in the report by either clicking on the pages listed below, or by using the keyword search tool below to find specific information within the annual report.-
 1
1 -
2
-
3
-
4
-
5
-
6
-
7
-
8
-
9
-
10
-
11
-
12
-
13
-
14
-
15
-
16
-
17
-
18
-
19
-
20
-
21
-
22
-
23
-
24
-
25
-
26
-
27
-
28
-
29
-
30
-
31
-
32
-
33
-
34
-
35
-
36
-
37
-
38
-
39
-
40
-
41
-
42
-
43
-
44
-
45
-
46
-
47
-
48
-
49
-
50
-
51
-
52
-
53
-
54
-
55
-
56
-
57
-
58
-
59
-
60
-
61
-
62
-
63
-
64
-
 65
65 -
 66
66 -
 67
67 -
 68
68 -
 69
69 -
 70
70 -
 71
71 -
 72
72 -
 73
73 -
 74
74 -
 75
75 -
 76
76 -
 77
77 -
 78
78 -
 79
79 -
 80
80 -
 81
81 -
 82
82
 |
 |

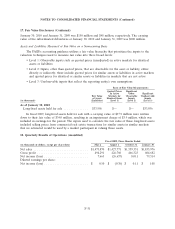
NOTES TO CONSOLIDATED FINANCIAL STATEMENTS (Continued)
16. Asset Impairment and Store Closing Charges (Continued)
A breakdown of the asset impairment and store closing charges follows:
Fiscal 2009 Fiscal 2008 Fiscal 2007
Number Number Number
of Impairment of Impairment of Impairment
(in thousands of dollars) Locations Amount Locations Amount Locations Amount
Stores closed in previous fiscal year ..... 2 $3,084 1 $ 800 1 $ 687
Stores closed in current fiscal year ...... — — 9 31,993 4 3,647
Stores to close in next fiscal year ....... — — 5 18,811 5 5,083
Stores impaired based on cash flows ..... — — 25 86,094 6 9,113
Non-operating facility ............... — — 1 493 1 1,970
Distribution center ................. — — 1 925 — —
Joint ventures ..................... — — 2 58,806 — —
Total .......................... 2 $3,084 44 $197,922 17 $20,500
The following is a summary of the activity in the reserve established for store closing charges:
Balance,
Beginning Adjustments Balance,
(in thousands of dollars) of Year and Charges Cash Payments End of Year
Fiscal 2009
Rent, property taxes and utilities ............... $5,240 $ 691 $3,433 $2,498
Fiscal 2008
Rent, property taxes and utilities ............... 4,355 4,474 3,589 5,240
Fiscal 2007
Rent, property taxes and utilities ............... 3,406 2,675 1,726 4,355
Reserve amounts are recorded in trade accounts payable and accrued expenses and other liabilities
17. Fair Value Disclosures
The estimated fair values of financial instruments which are presented herein have been
determined by the Company using available market information and appropriate valuation
methodologies. However, considerable judgment is required in interpreting market data to develop
estimates of fair value. Accordingly, the estimates presented herein are not necessarily indicative of
amounts the Company could realize in a current market exchange.
The fair value of the Company’s long-term debt and subordinated debentures is based on market
prices or dealer quotes (for publicly traded unsecured notes) and on discounted future cash flows using
current interest rates for financial instruments with similar characteristics and maturities (for bank
notes and mortgage notes).
The fair value of the Company’s cash and cash equivalents and trade accounts receivable
approximates their carrying values at January 30, 2010 and January 31, 2009 due to the short-term
maturities of these instruments. The fair values of the Company’s long-term debt at January 30, 2010
and January 31, 2009 were approximately $645 million and $315 million, respectively. The carrying
value of the Company’s long-term debt at January 30, 2010 and January 31, 2009 was approximately
$749 million and $783 million, respectively. The fair value of the subordinated debentures at
F-30