Dillard's 2009 Annual Report Download - page 16
Download and view the complete annual report
Please find page 16 of the 2009 Dillard's annual report below. You can navigate through the pages in the report by either clicking on the pages listed below, or by using the keyword search tool below to find specific information within the annual report.-
 1
1 -
2
-
3
-
4
-
5
-
 6
6 -
 7
7 -
 8
8 -
 9
9 -
 10
10 -
 11
11 -
 12
12 -
 13
13 -
 14
14 -
 15
15 -
 16
16 -
 17
17 -
 18
18 -
 19
19 -
 20
20 -
 21
21 -
 22
22 -
 23
23 -
 24
24 -
 25
25 -
 26
26 -
27
-
28
-
29
-
30
-
31
-
32
-
33
-
34
-
35
-
36
-
37
-
38
-
39
-
40
-
41
-
42
-
43
-
44
-
45
-
46
-
47
-
48
-
49
-
50
-
51
-
52
-
53
-
54
-
55
-
56
-
57
-
58
-
59
-
60
-
61
-
62
-
63
-
64
-
65
-
66
-
67
-
68
-
69
-
70
-
71
-
72
-
73
-
74
-
75
-
76
-
77
-
78
-
79
-
80
-
81
-
82
 |
 |

26MAR201010182659
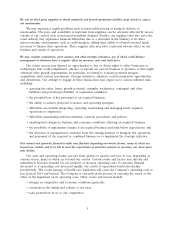
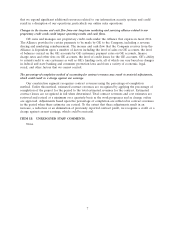
Company Performance
For each of the last five fiscal years, the graph below compares the cumulative total returns on the
Company’s Class A Common Stock, the Standard & Poor’s 500 Index and the Standard & Poor’s
Supercomposite Department Stores Index. The cumulative total return on the Company’s Class A
Common Stock assumes $100 invested in such stock on January 30, 2005 and assumes reinvestment of
dividends.
$200
$150
$100
$50
$0
2005 2006 2007 2008 2009
Dillard S&P 500 S&P Supercomposite Dept. Strs
Dollars
Stock Performance Graph
2005 2006 2007 2008 2009
Dillard’s, Inc. ............................. $100.09 $135.93 $ 80.29 $17.26 $ 66.98
S&P 500 ................................. 111.66 128.15 125.80 76.17 101.49
S&P Supercomposite Department Stores .......... 119.47 173.30 112.14 51.02 86.13
12