Dell 2000 Annual Report Download - page 34
Download and view the complete annual report
Please find page 34 of the 2000 Dell annual report below. You can navigate through the pages in the report by either clicking on the pages listed below, or by using the keyword search tool below to find specific information within the annual report.-
 1
1 -
2
-
3
-
4
-
5
-
6
-
7
-
8
-
9
-
10
-
11
-
12
-
13
-
14
-
15
-
16
-
17
-
18
-
19
-
20
-
21
-
22
-
23
-
 24
24 -
 25
25 -
 26
26 -
 27
27 -
 28
28 -
 29
29 -
 30
30 -
 31
31 -
 32
32 -
 33
33 -
 34
34 -
 35
35 -
 36
36 -
 37
37 -
 38
38 -
 39
39 -
 40
40 -
 41
41 -
 42
42 -
 43
43 -
 44
44 -
45
-
46
-
47
-
48
-
49
-
50
-
51
-
52
-
53
-
54
-
55
-
56
-
57
-
58
-
59
-
60
-
61
-
62
-
63
-
64
 |
 |

Fiscal Year Ended
February 2, January 28, January 29,
2001 2000 1999
(in millions)
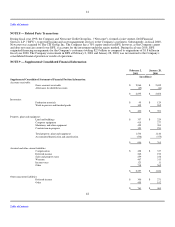
Supplemental Consolidated Statement of Income Information
Research, development and engineering expenses:
Research and development expenses $ 363 $ 292 $ 209
Purchased research and development — 194 —
Engineering expenses 119 82 63
$ 482 $ 568 $ 272
Investment and other income, net:
Investment and other income, net $ 578 $ 222 $ 64
Interest expense (47) (34) (26)
$ 531 $ 188 $ 38
Supplemental Consolidated Statement of Cash Flows Information
Changes in operating working capital accounts:
Accounts receivable, net $ (346) $ (394) $ (598)
Inventories (7) (123) (41)
Accounts payable 748 988 743
Accrued and other liabilities 367 416 255
Other, net (91) (75) 8
$ 671 $ 812 $ 367
Supplemental cash flow information:
Income taxes paid (received) $ (32) $ (363) $ 138
Interest paid 49 34 19
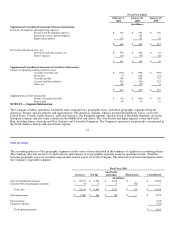
NOTE 10 — Segment Information
The Company conducts operations worldwide and is managed on a geographic basis, with those geographic segments being the
Americas, Europe, and Asia-Pacific and Japan regions. The Americas segment, which is based in Round Rock, Texas, covers the
United States, Canada, South America, and Latin America. The European segment, which is based in Bracknell, England, covers the
European countries and also some countries in the Middle East and Africa. The Asia-Pacific and Japan segment covers the Pacific
Rim, including Japan, Australia and New Zealand, and is based in Singapore. The Company's operations are primarily concentrated in
the North America, Europe and Asia-Pacific regions.
43
Table of Contents
The accounting policies of the geographic segments are the same as those described in the summary of significant accounting policies.
The Company allocates resources to and evaluates performance of its geographic segments based on operating income. Transfers
between geographic areas are recorded using internal transfer prices set by the Company. The table below presents information about
the Company's reportable segments:
Fiscal Year 2001
Asia-Pacific
Americas Europe and Japan Eliminations Consolidated
(in millions)
Sales to unaffiliated customers $ 22,871 $ 6,399 $ 2,618 $ — $ 31,888
Transfers between geographic segments 43 5 4 (52) —
Total sales $ 22,914 $ 6,404 $ 2,622 $ (52) $ 31,888
Operating income $ 2,480 $ 406 $ 192 $ — $ 3,078
Special charge (105)
Corporate expenses (310)
Total operating income $ 2,663