Dell 2000 Annual Report Download - page 17
Download and view the complete annual report
Please find page 17 of the 2000 Dell annual report below. You can navigate through the pages in the report by either clicking on the pages listed below, or by using the keyword search tool below to find specific information within the annual report.-
 1
1 -
2
-
3
-
4
-
5
-
6
-
 7
7 -
 8
8 -
 9
9 -
 10
10 -
 11
11 -
 12
12 -
 13
13 -
 14
14 -
 15
15 -
 16
16 -
 17
17 -
 18
18 -
 19
19 -
 20
20 -
 21
21 -
 22
22 -
 23
23 -
 24
24 -
 25
25 -
 26
26 -
 27
27 -
28
-
29
-
30
-
31
-
32
-
33
-
34
-
35
-
36
-
37
-
38
-
39
-
40
-
41
-
42
-
43
-
44
-
45
-
46
-
47
-
48
-
49
-
50
-
51
-
52
-
53
-
54
-
55
-
56
-
57
-
58
-
59
-
60
-
61
-
62
-
63
-
64
 |
 |

Table of Contents
overall economy. Average revenue per unit sold in fiscal year 2000 decreased 8% compared to fiscal year 1999, which mostly resulted
from the Company's pricing strategy.
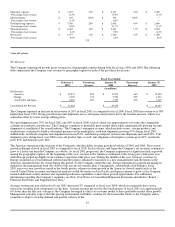
Gross Margin
As a percentage of consolidated net revenue, gross margin decreased slightly from 20.7% in fiscal year 2000 to 20.2% in fiscal year
2001. Most of the decrease occurred in the fourth quarter of the year as the Company quickly passed component cost savings to its
customers and also leveraged the strength of its model to drive profitable market share growth. Earlier in the year the Company
experienced overall gross margins of approximately 21%, whereas overall they had declined to approximately 18% by the end of the
fiscal year. Based on the industry, economic and other factors discussed above, the Company currently expects that this gross margin
environment will likely continue for the foreseeable future. Management believes that the strength of the Company's direct-to-
customer business model, as well as its strong liquidity position, result in the Company being better suited than its competitors to
profitably grow market share in the current business climate.
The decrease in gross margin as a percentage of consolidated net revenue in fiscal year 2000 over fiscal year 1999 was primarily
attributable to increased component costs, in part due to a higher than expected cost increase for memory components during the last
half of the year.
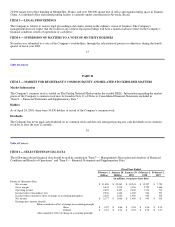
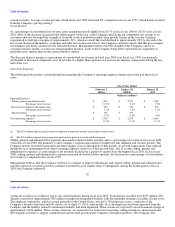
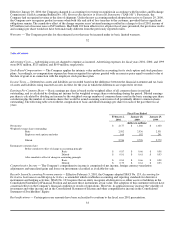
Operating Expenses
The following table presents certain information regarding the Company's operating expenses during each of the past three fiscal
years:
Fiscal Year Ended
February 2, January 28, January 29,
2001(a) 2000(b) 1999
(dollars in millions)
Operating Expenses:
Selling, general and administrative $ 3,193 $ 2,387 $ 1,788
Percentage of net revenue 10.0% 9.4% 9.8%
Research, development and engineering $ 482 $ 374 $ 272
Percentage of net revenue 1.5% 1.5% 1.5%
Special charges $ 105 $ 194 —
Percentage of net revenue 0.3% 0.8% 0.0%
Total operating expenses $ 3,780 $ 2,955 $ 2,060
Percentage of net revenue 11.8% 11.7% 11.3%
(a) The $105 million special charge relates to employee termination benefits and facilities closure costs.
(b) The $194 million special charge represents purchased in-process research and development.
Selling, general and administrative expenses increased in absolute dollar amounts and as a percentage of revenue in fiscal year 2001
versus fiscal year 2000, due primarily to the Company's original expectations for higher net unit shipment and revenue growth. The
Company heavily invested in personnel and other support costs in anticipation of that growth. As growth expectations were reduced
during the year, management took steps to manage expenses relative to actual growth rates, and as a result selling, general and
administrative expenses as a percentage of net revenues declined on a quarter-to-quarter basis throughout fiscal 2001. In fiscal year
2000, selling, general and administrative expense increased in absolute dollar amounts, but decreased as a percentage of consolidated
net revenue as compared to fiscal year 1999.
Management believes that the Company will have to continue to improve efficiencies and control selling, general and administrative
expenses relative to revenue growth to continue to profitably grow market share. Consequently, during the fourth quarter of fiscal
2001, the Company undertook
20
Table of Contents
a program to reduce its workforce and to exit certain facilities during fiscal year 2002. Total charges recorded were $105 million. The
charges consisted of approximately $50 million in employee termination benefits with the remainder relating to facilities closure costs.
The employee separations, which occurred primarily in the United States, affected 1,700 employees across a majority of the
Company's business functions and job classes. As of April 15, 2001, substantially all of the employees had been separated from the
Company and the liability related to termination benefits had been liquidated. These actions are expected to result in annual savings of
approximately $100 million. These savings, however, are expected to be reinvested via pricing, selling incentives, and research and
development activities to support continued unit and revenue growth in the Company's enterprise products. The Company will