Dell 2000 Annual Report Download - page 16
Download and view the complete annual report
Please find page 16 of the 2000 Dell annual report below. You can navigate through the pages in the report by either clicking on the pages listed below, or by using the keyword search tool below to find specific information within the annual report.-
 1
1 -
2
-
3
-
4
-
5
-
 6
6 -
 7
7 -
 8
8 -
 9
9 -
 10
10 -
 11
11 -
 12
12 -
 13
13 -
 14
14 -
 15
15 -
 16
16 -
 17
17 -
 18
18 -
 19
19 -
 20
20 -
 21
21 -
 22
22 -
 23
23 -
 24
24 -
 25
25 -
 26
26 -
27
-
28
-
29
-
30
-
31
-
32
-
33
-
34
-
35
-
36
-
37
-
38
-
39
-
40
-
41
-
42
-
43
-
44
-
45
-
46
-
47
-
48
-
49
-
50
-
51
-
52
-
53
-
54
-
55
-
56
-
57
-
58
-
59
-
60
-
61
-
62
-
63
-
64
 |
 |

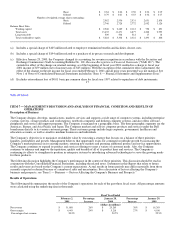
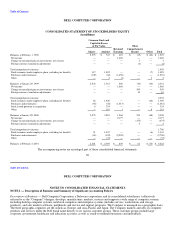
Operating expenses $ 3,675 33% $ 2,761 34% $ 2,060
Percentage of net revenue 11.5% 10.9% 11.3%
Special charges $ 105 (45)% $ 194 100% —
Percentage of net revenue 0.3% 0.8% —
Total operating expenses $ 3,780 28% $ 2,955 43% $ 2,060
Percentage of net revenue 11.8% 11.7% 11.3%
Operating income $ 2,663 18% $ 2,263 11% $ 2,046
Percentage of net revenue 8.4% 9.0% 11.2%
Net income $ 2,177 31% $ 1,666 14% $ 1,460
Percentage of net revenue 6.8% 6.6% 8.0%
18
Table of Contents
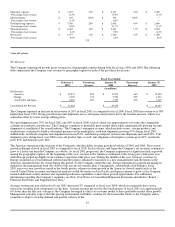
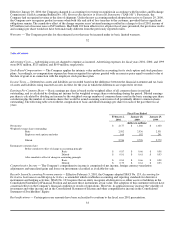
Net Revenue
The Company experienced growth in net revenue for all geographic regions during both fiscal years 2001 and 2000. The following
table summarizes the Company's net revenue by geographic region for each of the past three fiscal years:
Fiscal Year Ended
February 2, Percentage January 28, Percentage January 29,
2001 Increase 2000 Increase 1999
(in millions)
Net Revenue:
Americas $ 22,871 28% $ 17,879 44% $ 12,420
Europe 6,399 14% 5,590 20% 4,674
Asia Pacific and Japan 2,618 46% 1,796 56% 1,149
Consolidated Net Revenue $ 31,888 $ 25,265 $ 18,243
The Company reported an increase in net revenue of 26% in fiscal 2001 as compared to fiscal 2000. Fiscal 2000 net revenue was 38%
higher than fiscal 1999. Strong growth in net unit shipments across all regions and products drove the revenue increase, which was
somewhat offset by lower average selling prices.
Net unit shipments grew 29% for fiscal 2001 and 50% in fiscal 2000, each of which was approximately two times the comparable
calendar year industry growth rates. The Company continues to profitably grow market share while simultaneously growing net unit
shipments at a multiple of the overall industry. The Company's enterprise systems, which include servers, storage products and
workstations, continued to build a substantial presence in the marketplace, with unit shipments growing 47% during fiscal 2001.
Additionally, notebook computer unit shipments increased 52%, and desktop computer systems unit shipments increased 22%. Unit
shipments grew during fiscal year 2000 across all product lines as well: unit shipments of enterprise systems grew 81%, notebooks
grew 61% and desktops grew 46%.
The Americas represented the majority of the Company's absolute dollar revenue growth in both fiscal 2001 and 2000. Net revenue
growth in Europe slowed in fiscal 2001 as compared to fiscal 2000. In Asia-Pacific and Japan the Company's net revenues continue to
grow at a faster rate than the Company as a whole. As fiscal 2001 progressed, the Company experienced a significant shift in growth
among the geographic regions. At the beginning of the year, revenue in the Americas continued at the strong pace of the prior year
while Europe picked up slightly from weakness experienced the prior year. During the middle of the year, however, revenues in
Europe weakened as overall demand softened and the region continued to transition to a new management team. Revenues in the
Americas remained relatively strong during this period. As the Company exited the year, Europe experienced a significant pickup in
demand as the management team was able to fully execute its business plan. Consequently, substantially all of Europe's fiscal
2001 year-over-year growth occurred in the fourth quarter; whereas revenue growth in the Americas slowed significantly as the
overall United States economy and financial markets cooled. Revenues in Asia-Pacific and Japan continue to grow as the Company
entered additional country markets and expanded production capabilities to meet these growth opportunities. For additional
information regarding the Company's segments, see Note 10 of Notes to Consolidated Financial Statements included in "Item 8 —
Financial Statements and Supplementary Data."
Average revenue per unit sold in fiscal year 2001 decreased 2% compared to fiscal year 2000, which was primarily due to price
reductions resulting from component cost declines. Average revenue per unit for the fourth quarter of fiscal 2001 was approximately
6% lower than the full year average as the Company leveraged its direct-to-customer model to drive profitable market share growth.
Management currently expects that this pricing environment will likely continue for the foreseeable future as the Company and its
competitors adapt to slowing demand and general softness in the
19