Dell 2000 Annual Report Download - page 18
Download and view the complete annual report
Please find page 18 of the 2000 Dell annual report below. You can navigate through the pages in the report by either clicking on the pages listed below, or by using the keyword search tool below to find specific information within the annual report.
continue to manage its operating expenses relative to expected revenue growth, and will undertake additional cost-cutting actions if
necessary to enable it to continue to profitably grow market share.
The Company continues to invest in research, development and engineering activities to develop and introduce new products and to
support its continued goal of improving and developing efficient procurement, manufacturing and distribution processes. As a result,
research, development and engineering expenses have increased each year in absolute dollars due to increased staffing levels and
product development costs, although, as a percent of revenue, these costs have remained level. The Company expects to continue to
increase its absolute dollar amount of research, development and engineering spending with an increasing emphasis on enterprise
products, including servers and storage. During fiscal 2000, as a result of the acquisition of ConvergeNet Technologies, Inc.,
purchased in-process research and development in the amount of $194 million was expensed.
Income Taxes
The Company's effective tax rate was 30% for fiscal year 2001 compared to 32% for fiscal year 2000 and 30% for fiscal year 1999.
The differences in the effective tax rates among fiscal years result from changes in the geographical distribution of taxable income and
losses and certain non tax-deductible charges. The Company's effective tax rate is lower than the U.S. federal statutory rate of 35%,
principally because of the Company's geographical distribution of taxable income.
Investment and Other Income, Net
Investment and other income, net increased in absolute dollar amounts during fiscal 2001 as compared to the fiscal 2000. The increase
is due primarily to gains on the sale of investments and higher interest income. See below for further discussion.
Liquidity and Capital Resources
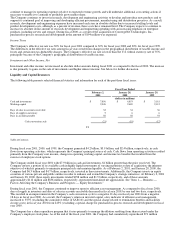
The following table presents selected financial statistics and information for each of the past three fiscal years:
Fiscal Year Ended
February 2, January 28, January 29,
2001 2000 1999
(dollars in millions)
Cash and investments $ 7,856 $ 6,853 $ 3,181
Working capital 2,948 2,489 2,112
Days of sales in accounts receivable 32 34 36
Days of supply in inventory 5 6 6
Days in accounts payable 58 58 54
Cash conversion cycle (21) (18) (12)
21
Table of Contents
During fiscal year 2001, 2000, and 1999, the Company generated $4.2 billion, $3.9 billion, and $2.4 billion, respectively, in cash
flows from operating activities, which represents the Company's principal source of cash. Cash flows from operating activities resulted
primarily from the Company's net income, changes in operating working capital, and income tax benefits that resulted from the
exercise of employee stock options.
The Company ended fiscal year 2001 with $7.9 billion in cash and investments, $1 billion greater than the prior year level. The
Company invests a portion of its available cash in highly liquid investments of varying maturities at date of acquisition, the inherent
objective of which is primarily to minimize principal risk and maintain liquidity. As of February 2, 2001, and January 28, 2000, the
Company had $6.3 billion and $4.7 billion, respectively, invested in these investments. Additionally, the Company invests in equity
securities of various private and public entities in order to enhance and extend the Company's strategic initiatives. At February 2, 2001
and January 28, 2000, these equity investments totaled $938 million and $1.5 billion, respectively, and of those amounts
approximately $112 million and $856 million, respectively, represented unrealized net appreciation. See "Item 1 — Business —
Factors Affecting the Company's Business and Prospects — Equity Investments."
During fiscal year 2001, the Company continued to improve upon its efficient asset management. As compared to fiscal year 2000,
days of supply in inventory and days of sales in accounts receivable decreased in fiscal year 2001 by one and two days, respectively.
This resulted in an improvement in the Company's cash conversion cycle to a negative 21 days in fiscal year 2001 from a negative
18 days in fiscal year 2000. As a result, the Company's return on invested capital, a key indicator of efficient asset management,
increased to 355% (excluding the cumulative effect of SAB 101 and the special charge related to termination benefits and facilities
closure costs) in fiscal year 2001 from 243% (excluding a special charge for purchased in-process research and development) in fiscal
year 2000.
The Company has a share repurchase program that it uses primarily to manage the dilution resulting from shares issued under the
Company's employee stock plans. As of the end of the fiscal year 2001, the Company had cumulatively repurchased 871 million


