Dell 2000 Annual Report Download - page 23
Download and view the complete annual report
Please find page 23 of the 2000 Dell annual report below. You can navigate through the pages in the report by either clicking on the pages listed below, or by using the keyword search tool below to find specific information within the annual report.-
 1
1 -
2
-
3
-
4
-
5
-
6
-
7
-
8
-
9
-
10
-
11
-
12
-
 13
13 -
 14
14 -
 15
15 -
 16
16 -
 17
17 -
 18
18 -
 19
19 -
 20
20 -
 21
21 -
 22
22 -
 23
23 -
 24
24 -
 25
25 -
 26
26 -
 27
27 -
 28
28 -
 29
29 -
 30
30 -
 31
31 -
 32
32 -
 33
33 -
34
-
35
-
36
-
37
-
38
-
39
-
40
-
41
-
42
-
43
-
44
-
45
-
46
-
47
-
48
-
49
-
50
-
51
-
52
-
53
-
54
-
55
-
56
-
57
-
58
-
59
-
60
-
61
-
62
-
63
-
64
 |
 |

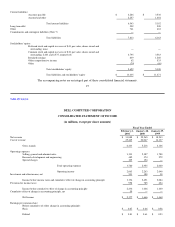
After cumulative effect of change in accounting principle:
Basic $ 0.84 $ 0.66 $ 0.58
Diluted $ 0.79 $ 0.61 $ 0.53
Weighted average shares outstanding:
Basic 2,582 2,536 2,531
Diluted 2,746 2,728 2,772
The accompanying notes are an integral part of these consolidated financial statements.
28
Table of Contents
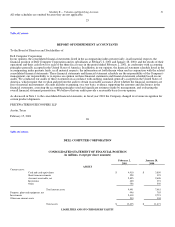
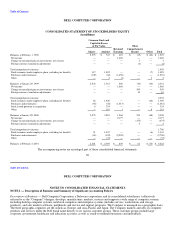
DELL COMPUTER CORPORATION
CONSOLIDATED STATEMENT OF CASH FLOWS
(in millions)
Fiscal Year Ended
February 2, January 28, January 29,
2001 2000 1999
Cash flows from operating activities:
Net income $ 2,177 $ 1,666 $ 1,460
Adjustments to reconcile net income to net cash provided by operating activities:
Depreciation and amortization 240 156 103
Tax benefits of employee stock plans 929 1,040 444
Special charges 105 194 —
Gain on sale of investments (307) (80) (9)
Other 109 56 20
Changes in:
Operating working capital 671 812 367
Non-current assets and liabilities 271 82 51
Net cash provided by operating activities 4,195 3,926 2,436
Cash flows from investing activities:
Investments:
Purchases (2,606) (3,101) (1,938)
Maturities and sales 2,331 2,319 1,304
Capital expenditures (482) (401) (296)
Net cash used in investing activities (757) (1,183) (930)
Cash flows from financing activities:
Purchase of common stock (2,700) (1,061) (1,518)
Issuance of common stock under employee plans 404 289 212
Proceeds from issuance of long-term debt, net of issuance costs — 20 494
Other (9) 57 —
Net cash used in financing activities (2,305) (695) (812)
Effect of exchange rate changes on cash (32) 35 (10)
Net increase in cash 1,101 2,083 684
Cash and cash equivalents at beginning of period 3,809 1,726 1,042
Cash and cash equivalents at end of period $ 4,910 $ 3,809 $ 1,726
The accompanying notes are an integral part of these consolidated financial statements.
29