DHL 1999 Annual Report Download - page 4
Download and view the complete annual report
Please find page 4 of the 1999 DHL annual report below. You can navigate through the pages in the report by either clicking on the pages listed below, or by using the keyword search tool below to find specific information within the annual report.-
 1
1 -
 2
2 -
 3
3 -
 4
4 -
 5
5 -
 6
6 -
 7
7 -
 8
8 -
 9
9 -
 10
10 -
 11
11 -
 12
12 -
 13
13 -
 14
14 -
 15
15 -
16
-
17
-
18
-
19
-
20
-
21
-
22
-
23
-
24
-
25
-
26
-
27
-
28
-
29
-
30
-
31
-
32
-
33
-
34
-
35
-
36
-
37
-
38
-
39
-
40
-
41
-
42
-
43
-
44
-
45
-
46
-
47
-
48
-
49
-
50
-
51
-
52
-
53
-
54
-
55
-
56
-
57
-
58
-
59
-
60
-
61
-
62
-
63
-
64
-
65
-
66
-
67
-
68
-
69
-
70
-
71
-
72
-
73
-
74
-
75
-
76
-
77
-
78
-
79
-
80
-
81
-
82
-
83
-
84
-
85
-
86
-
87
-
88
-
89
-
90
-
91
-
92
-
93
-
94
-
95
-
96
-
97
-
98
-
99
-
100
-
101
-
102
-
103
-
104
-
105
-
106
-
107
-
108
-
109
-
110
-
111
-
112
-
113
-
114
-
115
-
116
-
117
-
118
-
119
-
120
-
121
-
122
-
123
-
124
-
125
-
126
-
127
-
128
-
129
-
130
-
131
-
132
-
133
-
134
-
135
-
136
-
137
-
138
-
139
 |
 |

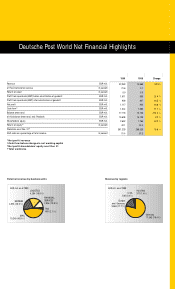
Revenue EUR mill.
of this international revenue in percent
Return on sales1) in percent
Profit from operations (EBIT) before amortization of goodwill EUR mill.
Profit from operations (EBIT) after amortization of goodwill EUR mill.
Net profit EUR mill.
Cash flow 2) EUR mill.
Balance sheet total EUR mill.
of this balance sheet total, excl. Postbank EUR mill.
Shareholders’ equity EUR mill.
Return on equity3) in percent
Workforce as of Dec. 314)
Staff costs as a percentage of total revenue in percent
Deutsche Post World Net Financial Highlights
1999 1998 Change
22,363 14,669 52.5 %
21.6 2.1
5.0 6.3
1,011 833 21.4 %
939 827 13.5 %
1,117 925 20.8 %
1,544 1,382 11.7 %
77,118 15,120 410 .0 %
15,608 15,120 3.2 %
2,652 1,765 50.3 %
42.1 52.4
301,229 260,520 15.6 %
51.4 67.2
EUR mill. as of 1999
U.S.A.
536 (2.4 %)
Revenue by regions
Europe
excl. Germany
3,968 (17.7 %)
Germany
17,542 (78.4 %)
Asia/Rest
317 (1.4%)
EUR mill. as of 1999
External revenue by business units
1) Net profit / revenue
2) Cash flow before changes in net working capital
3) Net profit/shareholders’ equity as of Dec. 31
4) Total workforce
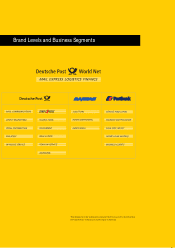
EXPRESS
4,594 (20.5 % )
Rest
469 (2.1 %)
LOGISTICS
4,204 (18.8 %)
FINANCIAL
SERVICES
2,856 (12.8 %)
MAIL
10,240 (45.8 %)