Cracker Barrel 2015 Annual Report Download - page 9
Download and view the complete annual report
Please find page 9 of the 2015 Cracker Barrel annual report below. You can navigate through the pages in the report by either clicking on the pages listed below, or by using the keyword search tool below to find specific information within the annual report.-
 1
1 -
 2
2 -
 3
3 -
 4
4 -
 5
5 -
 6
6 -
 7
7 -
 8
8 -
 9
9 -
 10
10 -
 11
11 -
 12
12 -
 13
13 -
 14
14 -
 15
15 -
 16
16 -
 17
17 -
 18
18 -
 19
19 -
 20
20 -
21
-
22
-
23
-
24
-
25
-
26
-
27
-
28
-
29
-
30
-
31
-
32
-
33
-
34
-
35
-
36
-
37
-
38
-
39
-
40
-
41
-
42
-
43
-
44
-
45
-
46
-
47
-
48
-
49
-
50
-
51
-
52
 |
 |

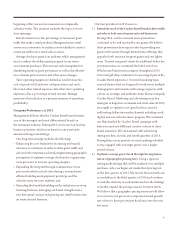
7
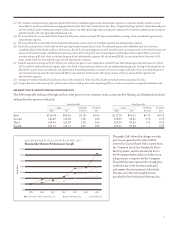
e graph (le) shows the changes over the
past six-year period in the value of $100
invested in Cracker BarrelOld Country Store,
Inc. Common Stock, the Standard& Poor’s
MidCap Index, and the Standard & Poor’s
400 Restaurant Index which we believe is an
adequate peer composite for the Company.
e ploed points represent the closing price
on the last day of the scal year indicated
andassume the reinvestment of dividends.
e data set forth in the graphhas been
provided by FactSet ResearchSystems, Inc.
CRACKER BARRELOLD COUNTRY STORE, INC.
In Dollars
Shareholder Return Performance Graph
$700
$100
$400
$300
$600
2011
2010 2012 2013 20152014
Cracker Barrel Old Country Store, Inc. S&P 400 Restaurant S&P Mid Cap
$0
2009
$500
$200
(a)We recorded a total provision of approximately$3,500, which is included in general and administrative expenses, to reectthe liability related to several
claims led as a putativecollective action allegingviolations of the Fair Labor StandardsAct. See“Item3. Legal Proceedings”of Part 1 of this Annual Report
on Form 10-K for further information related to these claims. Ourdebt renancing in the second quarterof scal 2015 resultedin additional interest expense
of $412 related to thewrite-oof deferred nancing costs.
(b)We incurred $4,313 in costsrelated to theNovember2013 proxy contest and April 2014 special shareholders’ meeting,which areincluded in general and
administrative expenses.
(c)We incurred $4,111 in costsrelated to theNovember2012 proxy contest, which are included in general and administrative expenses.
(d)Fiscal2012 consistedof 53 weekswhileall other periods presented consistedof 52 weeks. e estimated impactof the additional week was to increase
consolidatedscal 2012 results as follows: total revenue, $51,059; storeoperating income, 0.2% of total revenue; operating income, 0.2% of total revenue; net
income, 0.2% of total revenue; and diluted netincome per share, $0.27. As partof our restructuring of our eldorganization in April 2012, we incurred
severance charges of $1,660, which are included in general and administrative expenses. We also incurred$5,203 in costsrelated to theDecember 2011
proxy contest, which are also included in general and administrative expenses.
(e)Includes impairment charges of $3,219 beforetaxes and pre-tax gains on storedispositions of $4,109. Our debt renancing in the fourthquarter of scal
2011 resultedin additional interest expense of $5,136 relatedto transaction fees andthe write-oof deferred nancing costs. During thefourth quarter of
scal 2011, as part of our cost reduction and organization streamlining initiative, we incurred severance charges of $1,768, which are included in general
andadministrative expenses. We also incurred$404 in costsrelated to theDecember 2011 proxycontest, which are also included in general and
administrative expenses.
(f)Average unit volumes includesales of all stores. Fiscal2012 included a 53rd week while all other periods presented consistedof 52 weeks.
(g)Comparable storesales consist of sales of stores open at least six full quarters at the beginningof the year andare measuredon comparable calendar weeks.
MARKETPRICEAND DIVIDEND INFORMATION
e following table indicatesthe high and low sales prices of our common stock, as reported by Nasdaq, and dividends declared
andpaid for the quarters indicated.
Fiscal Year 2015 Fiscal Year 2014
PricesDividendsDividendsPricesDividendsDividends
High LowDeclared Paid High LowDeclared Paid
First $116.34 $96.50 $1.00 $1.00 $111.70 $96.32 $0.75 $0.75
Second 142.49 114.94 1.00 1.00 118.63 96.41 0.75 0.75
ird159.94 121.89 1.00 1.00 103.30 93.59 1.75 0.75
Fourth162.33 131.21 4.10 1.00 103.32 92.84 —0.75