Cracker Barrel 2015 Annual Report Download - page 8
Download and view the complete annual report
Please find page 8 of the 2015 Cracker Barrel annual report below. You can navigate through the pages in the report by either clicking on the pages listed below, or by using the keyword search tool below to find specific information within the annual report.-
 1
1 -
 2
2 -
 3
3 -
 4
4 -
 5
5 -
 6
6 -
 7
7 -
 8
8 -
 9
9 -
 10
10 -
 11
11 -
 12
12 -
 13
13 -
 14
14 -
 15
15 -
 16
16 -
 17
17 -
 18
18 -
 19
19 -
20
-
21
-
22
-
23
-
24
-
25
-
26
-
27
-
28
-
29
-
30
-
31
-
32
-
33
-
34
-
35
-
36
-
37
-
38
-
39
-
40
-
41
-
42
-
43
-
44
-
45
-
46
-
47
-
48
-
49
-
50
-
51
-
52
 |
 |

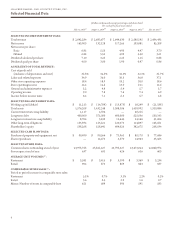
Selected Financial Data
CRACKER BARRELOLD COUNTRY STORE, INC.
(Dollars in thousands except percentages and sharedata)
Foreach of the scal yearsended
July 31, 2015(a)August 1, 2014(b)August 2, 2013(c)August 3, 2012(d)July 29, 2011(e)
SELECTED INCOME STATEMENT DATA :
Total revenue $2,842,284 $2,683,677 $2,644,630 $2,580,195 $2,434,435
Netincome 163,903 132,128 117,265 103,081 85,208
Netincome per share:
Basic 6.85 5.55 4.95 4.47 3.70
Diluted 6.82 5.51 4.90 4.40 3.61
Dividends declared per share7.10 3.25 2.25 1.15 0.88
Dividends paid per share4.00 3.00 1.90 0.97 0.86
AS PERCENT OF TOTAL REVENUE:
Cost of goods sold
(exclusive of depreciation and rent)32.5% 32.5% 32.3% 32.1% 31.7%
Labor and relatedexpenses 34.9 36.0 36.5 36.8 37.1
Other store operating expenses 18.4 18.9 18.2 18.0 18.6
Store operating income 14.2 12.6 13.0 13.1 12.6
General and administrative expenses 5.2 4.8 5.4 5.7 5.7
Operating income 9.0 7.8 7.6 7.4 6.9
Income before income taxes8.4 7.1 6.3 5.7 4.8
SELECTED BALANCE SHEET DATA:
Working capital (decit) $ 11,213 $(14,789) $(13,873) $18,249 $(21,188)
Total assets 1,576,208 1,432,248 1,388,306 1,418,992 1,310,884
Current interest rate swap liability1,117 4,704 —20,215 —
Long-termdebt 400,000 375,000 400,000 525,036 550,143
Long-terminterest rate swap liability8,704 3,239 11,644 14,166 51,604
Other long-termobligations133,594 123,221 120,073 114,897 105,661
Shareholders’ equity538,268 528,641 484,026 382,675 268,034
SELECTED CASH FLOW DATA:
Purchase of propertyand equipment, net $ 90,490 $90,564 $73,961 $80,170 $77,686
Share repurchases —12,473 3,570 14,923 33,563
SELECTED OTHER DATA:
Common sharesoutstanding at end of year23,975,755 23,821,227 23,795,327 23,473,024 22,840,974
Storesopen at end of year637 631 624 616 603
AVEGE UNIT VOLUMES (f):
Restaurant $ 3,581 $3,415 $3,390 $3,369 $3,234
Retail904 873 869 863 837
COMPABLESTORESALES(g):
Period to period increase in comparable store sales:
Restaurant 5.1% 0.7% 3.1% 2.2% 0.2%
Retail3.6 0.4 2.9 1.6 0.7
Memo: Number of stores in comparablebase 621 609 596 591 583
6