Cracker Barrel 2015 Annual Report Download - page 2
Download and view the complete annual report
Please find page 2 of the 2015 Cracker Barrel annual report below. You can navigate through the pages in the report by either clicking on the pages listed below, or by using the keyword search tool below to find specific information within the annual report.-
 1
1 -
 2
2 -
 3
3 -
 4
4 -
 5
5 -
 6
6 -
 7
7 -
 8
8 -
 9
9 -
 10
10 -
 11
11 -
 12
12 -
 13
13 -
14
-
15
-
16
-
17
-
18
-
19
-
20
-
21
-
22
-
23
-
24
-
25
-
26
-
27
-
28
-
29
-
30
-
31
-
32
-
33
-
34
-
35
-
36
-
37
-
38
-
39
-
40
-
41
-
42
-
43
-
44
-
45
-
46
-
47
-
48
-
49
-
50
-
51
-
52
 |
 |

%+<B&%BB5(9LQGG 30
O
n behalf of our more than 72,000 employees, I am pleased to share with you some of Cracker Barrel Old Country
Store, Inc.’s accomplishments from fiscal 2015. Our management team remains focused on our long-term
strategic plan to enhance the core business, expand the footprint of our stores, and extend the Cracker Barrel Old
Country Store®brand outside of our four walls. As a result of this commitment, we delivered a meaningful
increase in earnings per share versus the prior year.
In every quarter of the year, we grew comparable store restaurant and retail sales over the prior year quarter. This top-line
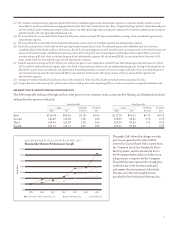
growth resulted in our continued outperformance of the Knapp-TrackTM Casual Dining Index. Our 5.1 percent comparable
store restaurant sales growth was driven by a year-over-year increase in traffic of 2.1 percent, an increase in our menu
pricing of 2.5 percent, and a positive sales mix impact from our promotional menu offerings. Our comparable store retail
sales increased 3.6 percent year-over-year.
In addition to growing total revenue by 5.9 percent to $2.8 billion, we successfully implemented new technology and
process improvements to reduce annual operating costs by approximately $20 million annualized. I am proud of our field
employees and their willingness to adapt to significant amounts of change, all while staying true to our mission of
“Pleasing People”.
As a result of our cost saving initiatives, and our ability to leverage sales to the bottom line, we improved our operating
margin to 9.0 percent, compared with 7.8 percent in 2014. We continue to generate strong cash flows. Net cash from
operating activities was $334 million, which funded $90 million of capital expenditures.
Supported by the strength of our financial results and our commitment to shareholder returns, the Board approved an
increase of our regular quarterly dividend to $1.10 per share, a 400 percent increase since May 2011; and for the first
time in the Company’s history, we declared a special dividend of $3.00 per share. Additionally, the market price per share
of the Company’s common stock was $151.89 at the close of business on the last day of the fiscal year (as reported by
Nasdaq on July 31, 2015), reflecting a 57 percent increase from the closing stock price on August 1, 2014.
Our achievements, however, were not contained just in our financial results. Fiscal 2015 included accomplishments in
many areas of our business.
We continued the build-out of our Wholesome Fixin’s®menu category. This category was added to our core menu in
August 2013 to meet our guests’ desire for additional better-for-you menu items. In 2015, we broadened the category
offerings to include entrees like our Southern Grilled Chicken Caesar Salad and Apple Cider BBQ Chicken Breast.
Our five seasonal menu promotions continued to be well received by our guests. We believe these promotions drive
repeat visits by providing our guests with variety through limited-time offerings that appeal to our most frequent guests
and our lighter users. Some of this year’s guest favorites were our Strawberries n’ Cream French Toast Breakfast and
our Mushroom Onion n’ Swiss Chopped Steak Country Dinner Plate.
Our retail store continues to be an integral part of the Cracker Barrel®experience. It serves as a major competitive
advantage and point of differentiation for us. We aren’t a destination retailer, but we have the advantage of drawing a lot of
potential retail customers from our restaurant guest traffic. We are pleased with the growth we experienced in our retail
sales during the fiscal year. In fiscal 2015, we averaged retail sales of approximately $430 per square foot while improving
cost of goods sold as a percent of revenue.
Our merchandising team remained focused on themes that are designed to work across multiple demographics and resonate
with a range of guests. We sourced merchandise that ensured broad multi-generational appeal with a focus on nostalgic
and unique retail items. Additionally, we focused on improving our inventory management process and ended the fiscal
year with approximately 10 percent less inventory.
Marketing and advertising have been key strategies to help drive restaurant and retail sales. As part of our three-year
strategic plan, we shared our intent to increase overall advertising spend in these areas as a percent of revenue,
and to optimize spend by reallocating dollars into alternative media channels including social, digital, and our exclusive
music program.