Cracker Barrel 2015 Annual Report Download - page 13
Download and view the complete annual report
Please find page 13 of the 2015 Cracker Barrel annual report below. You can navigate through the pages in the report by either clicking on the pages listed below, or by using the keyword search tool below to find specific information within the annual report.-
 1
1 -
2
-
 3
3 -
 4
4 -
 5
5 -
 6
6 -
 7
7 -
 8
8 -
 9
9 -
 10
10 -
 11
11 -
 12
12 -
 13
13 -
 14
14 -
 15
15 -
 16
16 -
 17
17 -
 18
18 -
 19
19 -
 20
20 -
 21
21 -
 22
22 -
 23
23 -
24
-
25
-
26
-
27
-
28
-
29
-
30
-
31
-
32
-
33
-
34
-
35
-
36
-
37
-
38
-
39
-
40
-
41
-
42
-
43
-
44
-
45
-
46
-
47
-
48
-
49
-
50
-
51
-
52
 |
 |

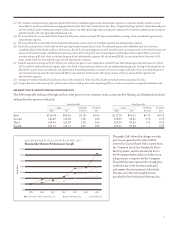
Total revenue benetedfrom the opening of 6, 7 and 8 new
storesin 2015, 2014 and 2013, respectively.
e following table highlights comparablestore sales* results
over the past two years:
Period to Period Increase
2015 vs 2014 2014 vs 2013
(621 Stores) (609 Stores)
Restaurant 5.1% 0.7%
Retail3.6 0.4
Restaurant & Retail 4.8 0.6
*Comparable storesales consist of sales of stores open at least six full
quarters at the beginningof the year andare measuredon comparable
calendar weeks.
Our comparablestore restaurant sales increase from2014
to 2015 resultedfrom a higher average check of 3.0%,
primarily aributableto a 2.5% average menu price increase
andan increase in guest trac of 2.1%. Our comparable store
restaurant sales increase from2013 to 2014 resulted from a
higher average check of 2.6%, primarily aributableto a 2.1%
average menu price increase, partially oset by a decrease in
guest trac of 1.9%.
e comparablestore retail sales increase from2014 to
2015 resultedprimarily from strong performance in apparel
andaccessories, bed and bathand home décormerchandise
categories and the increase in guest trac. e comparable
store retailsales increasefrom 2013 to 2014 resulted primarily
from strong performance in apparel and accessories and home
décor merchandise categories partially oset by a decline
in the bed and bathmerchandise category andthe decrease in
guest trac.
Cost of Goods Sold (Exclusive of Depreciation andRent)
e following table highlights the componentsof cost of goods
soldin dollaramounts for the past three years:
2015 2014 2013
Cost of Goods Sold:
Restaurant $630,417 $589,390 $571,825
Retail293,754 283,368 282,859
Total Cost of Goods Sold $924,171 $872,758 $854,684
e following table highlights restaurant cost of goods sold
as a percentage of restaurant revenuefor the past three years:
2015 2014 2013
Restaurant Cost of Goods Sold27.8% 27.6% 27.2%
e modest increase from2014 to 2015 was the result of
food commodity ination of 2.7% and a shito higher cost
menu items partially oset by our menu price increase
referenced above andlower food waste.Higher cost menu
items andlower food waste accounted for 0.2% and 0.1%,
respectively, in restaurant cost of goods soldas a percentage of
restaurant revenue.e increase from2013 to 2014 was
primarily the result of food commodity ination of 1.8%, a
shito highercost menu items andhigherfood waste
partially oset by our menu price increase referenced above.
Higher cost menu items andhigher food waste accounted
for 0.3% and 0.1%, respectively, in restaurant cost of goods
soldas a percentage of restaurant revenue.
We presently expect the rate of commodity ination to be
approximately3.0% to 4.0% in 2016 as comparedto 2015.
We expect to partially oset the eects of food commodity
ination through a combination of menu price increases,
supplycontracts and other cost reduction initiatives.
e following table highlights retail cost of goods soldas a
percentage of retail revenue for the past three years:
2015 2014 2013
Retail Cost of Goods Sold 51.3% 51.9% 52.4%
e decrease in retail cost of goods soldas a percentage of
retail revenuein 2015 as compared to 2014 resulted primarily
from lower markdownsand lower freight expense.
2014 to 2015
(Decrease) as a Percentage
of Total Revenue
Markdowns(0.3%)
Freight (0.2%)
e decrease in retail cost of goods soldas a percentage of
retail revenuein 2014 as compared to 2013 resulted primarily
from lower freight, higher initial markup on retail merchandise,
lower shrinkageand a reductionin the obsolescence inventory
reserve partially oset by higher markdowns.
11