Cracker Barrel 2015 Annual Report Download - page 16
Download and view the complete annual report
Please find page 16 of the 2015 Cracker Barrel annual report below. You can navigate through the pages in the report by either clicking on the pages listed below, or by using the keyword search tool below to find specific information within the annual report.
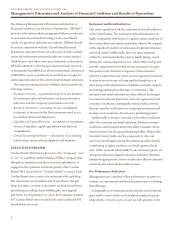
Interest Expense
e following table highlights interest expense for the past
three years:
2015 2014 2013
Interest expense $16,679 $17,557 $35,742
e year-to-year decrease from 2014 to 2015 resulted
primarily from lower weighted average interest rates partially
oset by the write-oof $412 in deferred nancing costs as
a result of our debt renancing. See the discussion below
under “Borrowing Capacity and DebtCovenants” for further
information on our debt renancing. We presently expect
interest expense for 2016 to be approximately $14,000 to
$15,000.
e year-to-year decrease from 2013 to 2014 resulted
primarily from lower interest rates because of the expiration
of our seven-year interest rate swap on May 3, 2013, which
had a xed interestrate of 5.57% plus our credit spread,and
lower debt outstanding.
Provision for Income Taxes
e following table highlights the provision for income taxes
as a percentage of income before income taxes (“eective tax
rate”)for the past three years:
2015 2014 2013
Eective tax rate 31.2% 30.8% 29.3%
e increase in our eective tax rate from 2014 to 2015
resulted primarily from lower employer taxcredits as a
percent of income before taxes. e increase in our eective
taxrate from 2013 to 2014 resulted primarily from the
expiration of the Work Opportunity Tax Credit (“WOTC”)
as of December 31, 2013.
We presently expect our eective tax rate for 2016 to be
between 32% and 33%. is estimate assumes that the
WOTC, which expired on December 31, 2014, is not renewed.
We estimate that the renewal of the WOTC could reduce
our provision for income taxes by $3,500 to $6,500 in 2016.
LIQUIDITY AND CAPITAL RESOURCES
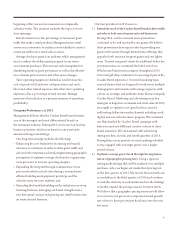
e following table presents a summaryof our cash owsfor
the last three years:
2015 2014 2013
Netcash provided by operating
activities $334,055 $177,625 $208,499
Netcash used in investing
activities(88,614) (88,815) (73,406)
Netcash used in nancing
activities(99,347) (91,167) (165,337)
Netincrease (decrease) in cash
andcash equivalents $146,094 $(2,357) $(30,244)
Our primary sources of liquidity are cash generated from
our operationsandour borrowingcapacity underour
revolving credit facility.Our internally generated cash, along
with cash on handat August 1, 2014, was sucient to nance
allof our growth, dividend payments, working capital needs
andother cash payment obligations in 2015.
We believe that cash at July 31, 2015, along with cash
expected to be generated from our operating activities and
the borrowing capacity under our revolving creditfacility
will be sucient to nance our continuing operations, our
continuing expansion plansand our expected dividend
payments for 2016.
Cash Generatedfrom Operations
e increase in net cash ow provided by operating activities
from 2014 to 2015 reected lower annual and long-term
incentive bonus paymentsmade in 2015 as a result of the prior
year’sperformance, the timing of paymentsfor accounts
payable, higher net income and lower retail inventories. Lower
retail inventories resultedfrom improved buying strategies,
fewer receipts of holiday merchandise andbeer general
inventory management.e decrease in net cash ow provided
by operating activities from2013 to 2014 reected the timing
of paymentsfor accountspayable and higher retail inventories.
Higher retail inventories at the end of 2014 resultedprimarily
from the early receipt of holiday andother merchandise and
lower than anticipatedsales in 2014.
14


