Cracker Barrel 2015 Annual Report Download - page 12
Download and view the complete annual report
Please find page 12 of the 2015 Cracker Barrel annual report below. You can navigate through the pages in the report by either clicking on the pages listed below, or by using the keyword search tool below to find specific information within the annual report.-
 1
1 -
 2
2 -
 3
3 -
 4
4 -
 5
5 -
 6
6 -
 7
7 -
 8
8 -
 9
9 -
 10
10 -
 11
11 -
 12
12 -
 13
13 -
 14
14 -
 15
15 -
 16
16 -
 17
17 -
 18
18 -
 19
19 -
 20
20 -
 21
21 -
 22
22 -
23
-
24
-
25
-
26
-
27
-
28
-
29
-
30
-
31
-
32
-
33
-
34
-
35
-
36
-
37
-
38
-
39
-
40
-
41
-
42
-
43
-
44
-
45
-
46
-
47
-
48
-
49
-
50
-
51
-
52
 |
 |

3) Apply technology and processenhancements to drive
store operating margins. We successfully implemented
new technology and process improvements to reduce
annual operating costs by approximately $20,000
annualized. ese improvements and initiatives included
plate reduction, retail labor scheduling and lighting
enhancement. Our new plate reduction guidelines drove
improvements in dish room labor and chemical usage
costs. Annual savings were also realizedthrough a
system-wide update to our retail labor scheduling and a
re-bulbing of all stores with new LED light technology.
We believe these initiativesfurther droveretail produc-
tivity and reduced our utilities expense,respectively,
while maintaining the overall guest experience. It is our
belief that these 2015 initiativesgenerated sustainable
improvements in our cost structure and drove higher
operating margins.
4) Continue thegrowthof the brand by developingand
opening new stores. During 2015, we opened six new
Cracker Barrel Old Country Store locations, including
one designed with our new store prototype, expanding
our chain to 637 stores in 42 states at year-end. We were
pleased with guests’ responses to our new prototype
design. As we gain knowledge from the performance of
our new prototype, we anticipate retrot opportunities
for individual initiativesthat can benet the performance
of our existing stores.
We believe the successful implementation of these four
priorities contributedto our revenuegrowthduring the year,
positive comparablestore restaurant andretail sales for the
year and higher operating marginand prot as compared to
the prior year.
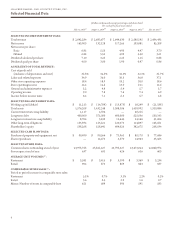
RESULTS OF OPETIONS
e following table highlights operating results over the past
three years: Relationship to Total Revenue
2015 2014 2013
Total revenue 100.0% 100.0% 100.0%
Cost of goods sold(exclusive of
depreciation and rent)32.5 32.5 32.3
Labor and other relatedexpenses 34.9 36.0 36.5
Other store operating expenses 18.4 18.9 18.2
Store operating income 14.2 12.6 13.0
General and administrative 5.2 4.8 5.4
Operating income 9.0 7.8 7.6
Interest expense 0.6 0.7 1.3
Income before income taxes8.4 7.1 6.3
Provision for income taxes 2.6 2.2 1.9
Netincome 5.8 4.9 4.4
Total Revenue
e following table highlights the key components of revenue
for the past three years:
2015 2014 2013
Revenuein dollars:
Restaurant $2,269,610 $2,137,405 $2,104,768
Retail572,674 546,272 539,862
Total revenue $2,842,284 $2,683,677 $2,644,630
Total revenue percentage
increase5.9% 1.5% 2.5%
Total revenue by percentage
relationships:
Restaurant 79.9% 79.6% 79.6%
Retail20.1% 20.4% 20.4%
Comparable number of stores 621 609 596
Comparable store averages
per store:
Restaurant $ 3,569 $3,422 $3,409
Retail894 871 871
Total $4,463 $4,293 $4,280
Restaurant average
weeklysales(1) $68.9 $65.7 $65.2
Retail averageweekly sales(1) 17.4 16.8 16.7
(1) Average weekly sales are calculated by dividing netsales by operating
weeks andinclude all stores.
10