Columbia Sportswear 2002 Annual Report Download - page 22
Download and view the complete annual report
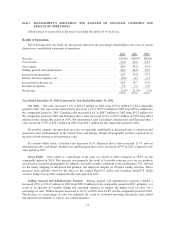
Please find page 22 of the 2002 Columbia Sportswear annual report below. You can navigate through the pages in the report by either clicking on the pages listed below, or by using the keyword search tool below to find specific information within the annual report.Interest (Income) Expense, Net:Interest income was $2.8 million in 2002 compared to $1.7 million for
the comparable period in 2001 and interest expense was $2.4 million in 2002 compared to $4.3 million for the
comparable period in 2001. These changes were attributable to an increase in cash compared to the same period
in 2001 and repayments of short-term notes payable.
Income Tax Expense: The provision for income taxes increased to $61.5 million in 2002 from $56.8
million in 2001. The effective tax rate was 37.5% for 2002 and 39.0% for 2001. The reduction in the 2002
effective tax rate was due to several factors including the relative mix of international and domestic profitability
and, to a lesser degree, the utilization of foreign tax credits.
Year Ended December 31, 2001 Compared to Year Ended December 31, 2000
Net Sales: Net sales increased 26.8% to $779.6 million in 2001 from $614.8 million for the comparable
period in 2000. Net sales in the United States increased 25.6% to $551.2 million in 2001 from $438.9 million for
the comparable period in 2000. Canadian sales increased 28.8% to $81.3 million in 2001 from $63.1 million for
the comparable period in 2000 and European direct sales increased 39.5% to $82.3 million in 2001 from $59.0
million for the comparable period in 2000. Net international sales, excluding Canadian sales and European direct
sales, increased 20.3% to $64.7 million in 2001 from $53.8 million for the comparable period in 2000. Overall,
sales growth was driven by the increased penetration of the Columbia brand within the existing customer base in
all markets as well as the introduction of Sorel branded footwear, primarily in North America, in fall 2001.
Specifically, domestic department store sales increased to approximately 35.2% in 2001 from approximately
30.5% in 2000.
By product category, the growth in net sales is attributable to increased sales of outerwear and footwear
units, including Sorel, predominantly in the United States, Canada and Europe as well as increased sales of
sportswear units primarily in the United States and Europe.
In constant dollar terms, Canadian sales increased 34.4%, European direct sales increased 43.2% and net
international sales, excluding Canadian sales and European direct sales, increased 29.4% in 2001 compared to the
same period in 2000.
Gross Profit:Gross profit as a percentage of net sales was 45.8% in 2001 compared to 45.6% for the
comparable period in 2000. This increase was due to the following factors including: (1) higher margins on
spring outerwear and reduction of close-out product shipments for the three months ended March 31, 2001 when
compared to the same period in 2000, (2) reduced impact of currency fluctuation, timely receipt of goods from
factories, and minimal off-priced selling for three months ended September 30, 2001 when compared to same
period in 2000, and (3) strong margins on outerwear closeout activity during the three months ended December
31, 2001. These increases were tempered by an increase in sales of spring close-out products which produce
lower margins and negative effects of the Euro currency during the six months ended June 30, 2001.
Selling, General and Administrative Expense: Selling, general, and administrative expense increased
13.8% to $209.0 million in 2001 from $183.7 million for the comparable period in 2000, primarily as a result of
an increase in variable selling and operating expenses to support the higher level of sales. As a percentage of
sales, SG&A expense decreased to 26.8% in 2001 from 29.9% for the comparable period in 2000. This change
was primarily due to strong sales growth in 2001, coupled with continued operating efficiencies from global
infrastructure investments and maintenance of prudent cost control measures given the current economic
environment.
Interest (Income) Expense, Net:Interest income was $1.7 million in 2001 compared to $1.1 million for
the comparable period in 2000 and interest expense was $4.3 million in 2001 compared to $5.3 million for the
comparable period in 2000. These changes were attributable to our increased cash position during the first,
15


