Build-A-Bear Workshop 2014 Annual Report Download - page 7
Download and view the complete annual report
Please find page 7 of the 2014 Build-A-Bear Workshop annual report below. You can navigate through the pages in the report by either clicking on the pages listed below, or by using the keyword search tool below to find specific information within the annual report.-
 1
1 -
 2
2 -
 3
3 -
 4
4 -
 5
5 -
 6
6 -
 7
7 -
 8
8 -
 9
9 -
 10
10 -
 11
11 -
 12
12 -
 13
13 -
 14
14 -
 15
15 -
 16
16 -
 17
17 -
 18
18 -
19
-
20
-
21
-
22
-
23
-
24
-
25
-
26
-
27
-
28
-
29
-
30
-
31
-
32
-
33
-
34
-
35
-
36
-
37
-
38
-
39
-
40
-
41
-
42
-
43
-
44
-
45
-
46
-
47
-
48
-
49
-
50
-
51
-
52
-
53
-
54
-
55
-
56
-
57
-
58
-
59
-
60
-
61
-
62
-
63
-
64
-
65
-
66
-
67
-
68
-
69
-
70
 |
 |

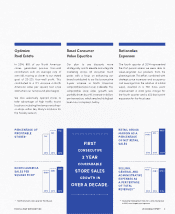
FIRST
CONSECUTIVE
2 YEAR
COMPARABLE
STORE SALES
GROWTH IN
OVER A DECADE.
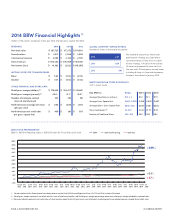
Optimize
Real Estate
In 2014, 98% of our North American
stores generated positive four-wall
contribution with an average rate of
over 18% moving us closer to our stated
goal of 20-22% four-wall profit. This
contributed to a 17% increase in North
American sales per square foot since
2012 when our turnaround plan began.
We also selectively opened stores to
take advantage of high trac tourist
locations including five temporary shop-
in-shops within key Macy’s locations for
the holiday season.
Reset Consumer
Value Equation
Our plan to use discounts more
strategically and to elevate and integrate
marketing across all consumer touch
points with a focus on enhancing our
brand contributed to our first consecutive
2-year increase in North American
comparable stores in over a decade. This
comparable store sales growth was
partially driven by a 9% increase in dollars
per transaction, which reached its highest
level in our company's history.
Rationalize
Expenses
The fourth quarter of 2014 represented
the first period where we were able to
value-engineer our products from the
planning state. This eort, combined with
strategic price increases and occupancy
cost leverage from the addition of a 53rd
week, resulted in a 730 basis point
improvement in retail gross margin for
the fourth quarter and a 450 basis point
expansion for the fiscal year.
SELLING,
GENERAL AND
ADMINISTRATIVE
EXPENSES AS
A PERCENTAGE
OF TOTAL
REVENUES**
PERCENTAGE OF
PROFITABLE
STORES*
NORTH AMERICA
SALES PER
SQUARE FOOT*
RETAIL GROSS
MARGIN AS A
PERCENTAGE
OF NET RETAIL
SALES
98%
90%
78%
201420132012
$381
201420132012
$409
$350
201420132012
41.3%
41.0%
42.7%
201420132012
45.6%
38.6% 41.1%
* North American stores open for the full year. ** Excluding management transition, store closing and,
in 2012, asset impairment expenses
BUILD-A-BEAR WORKSHOP, INC. 2014 ANNUAL REPORT 5