Build-A-Bear Workshop 2014 Annual Report Download - page 2
Download and view the complete annual report
Please find page 2 of the 2014 Build-A-Bear Workshop annual report below. You can navigate through the pages in the report by either clicking on the pages listed below, or by using the keyword search tool below to find specific information within the annual report.-
 1
1 -
 2
2 -
 3
3 -
 4
4 -
 5
5 -
 6
6 -
 7
7 -
 8
8 -
 9
9 -
 10
10 -
 11
11 -
 12
12 -
 13
13 -
14
-
15
-
16
-
17
-
18
-
19
-
20
-
21
-
22
-
23
-
24
-
25
-
26
-
27
-
28
-
29
-
30
-
31
-
32
-
33
-
34
-
35
-
36
-
37
-
38
-
39
-
40
-
41
-
42
-
43
-
44
-
45
-
46
-
47
-
48
-
49
-
50
-
51
-
52
-
53
-
54
-
55
-
56
-
57
-
58
-
59
-
60
-
61
-
62
-
63
-
64
-
65
-
66
-
67
-
68
-
69
-
70
 |
 |

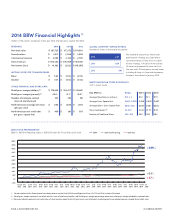
2014 BBW Financial Highlights (1)
Dollars in thousands, except per share, per store and per gross square foot data
REVENUES 2014 2013 2012
Net retail sales $ 387,725 $ 373,173 $ 374,553
Franchise fees $ 2,531 $ 3,564 $ 3,598
Commercial revenue $ 2,098 $ 2,332 $ 2,790
Total revenues $ 392,354 $ 379,069 $ 380,941
Net income (loss) $ 14,362 $ (2,112) $ (49,295)
INCOME LOSS PER COMMON SHARE
Basic $ 0.82 $ (0.13) $ (3.02)
Diluted $ 0.81 $ (0.13) $ (3.02)
OTHER FINANCIAL AND STORE DATA
Retail gross margin (dollars) (2) $ 176,838 $ 153,477 $ 145,687
Retail gross margin (percent) (2) 45.6% 41.1% 38.9%
Number of company-owned 324 323 351
stores at end of period
North American average net retail $ 1,158 $ 1,080 $ 1,003
sales per store
North American net retail sales $ 409 $ 381 $ 350
per gross square foot
GLOBAL COMPANYOWNED STORES
Number of stores at the end of the period
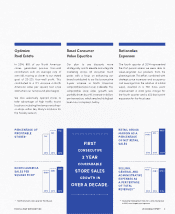
We started to execute our real estate
optimization strategy as a part of our
turnaround plans in late 2012. As a part
of that strategy, in fiscal 2014 we closed
15 stores and opened 16 stores to finish
the year with 324 company-owned stores
including 6 shop-in-shop and temporary
locations that closed in January 2015.
BBW STOCK PERFORMANCE
BBW vs. S&P 500 Retailing Index vs. S&P 500 Index for Fiscal Years 2013-2014
NORTH AMERICAN STORE ECONOMICS
With 1-4 year Goals
Key Metrics Goals 2014 2013 2012
Average Store Sales (in millions) $1.2-1.4 $1.2 $1.1 $1.0
Average Gross Square Feet 2,600-2,800 2,829 2,835 2,867
Average Sales / Gross Square Feet $450-500 $409 $381 $350
Store Contribution (3) 20-22% 18.4% 13.7% 8.9%
Number of Traditional Stores 240-260 245 253 283
2013 323
2014 324
2012 351
1. For description of this financial and store data, please see the fiscal 2014 Annual Report on Form 10-K. Fiscal 2014, includes 53rd week.
2. Retail gross margin represents net retail sales less cost of retail merchandise sold. Retail gross margin percentage represents retail gross margin divided by net retail sales.
3. Store contribution represents net retail sales of store locations open for the full year minus cost of product, marketing and store related expenses divided by net retail sales.
500%
300%
400%
200%
450%
250%
350%
100%
150%
50%
0%
-50%
BBW S&P 500 Retailing S&P 500
+389%
+60%
+47%
12/29
2012
1/31
2013
2/28
2013
3/31
2013
4/30
2013
5/31
2013
6/30
2013
7/31
2013
8/31
2013
9/30
2013
10/31
2012
11/30
2013
12/31
2012
1/31
2014
2/28
2014
3/31
2014
4/30
2014
5/31
2014
6/30
2014
7/31
2014
8/31
2014
9/30
2014
10/31
2014
11/30
2014
1/3
2015
BUILD-A-BEAR WORKSHOP, INC. 2014 ANNUAL REPORT