Bank of Montreal 2013 Annual Report Download - page 3
Download and view the complete annual report
Please find page 3 of the 2013 Bank of Montreal annual report below. You can navigate through the pages in the report by either clicking on the pages listed below, or by using the keyword search tool below to find specific information within the annual report.-
 1
1 -
 2
2 -
 3
3 -
 4
4 -
 5
5 -
 6
6 -
 7
7 -
 8
8 -
 9
9 -
 10
10 -
 11
11 -
 12
12 -
 13
13 -
 14
14 -
15
-
16
-
17
-
18
-
19
-
20
-
21
-
22
-
23
-
24
-
25
-
26
-
27
-
28
-
29
-
30
-
31
-
32
-
33
-
34
-
35
-
36
-
37
-
38
-
39
-
40
-
41
-
42
-
43
-
44
-
45
-
46
-
47
-
48
-
49
-
50
-
51
-
52
-
53
-
54
-
55
-
56
-
57
-
58
-
59
-
60
-
61
-
62
-
63
-
64
-
65
-
66
-
67
-
68
-
69
-
70
-
71
-
72
-
73
-
74
-
75
-
76
-
77
-
78
-
79
-
80
-
81
-
82
-
83
-
84
-
85
-
86
-
87
-
88
-
89
-
90
-
91
-
92
-
93
-
94
-
95
-
96
-
97
-
98
-
99
-
100
-
101
-
102
-
103
-
104
-
105
-
106
-
107
-
108
-
109
-
110
-
111
-
112
-
113
-
114
-
115
-
116
-
117
-
118
-
119
-
120
-
121
-
122
-
123
-
124
-
125
-
126
-
127
-
128
-
129
-
130
-
131
-
132
-
133
-
134
-
135
-
136
-
137
-
138
-
139
-
140
-
141
-
142
-
143
-
144
-
145
-
146
-
147
-
148
-
149
-
150
-
151
-
152
-
153
-
154
-
155
-
156
-
157
-
158
-
159
-
160
-
161
-
162
-
163
-
164
-
165
-
166
-
167
-
168
-
169
-
170
-
171
-
172
-
173
-
174
-
175
-
176
-
177
-
178
-
179
-
180
-
181
-
182
-
183
 |
 |

BMO Financial Group 196th Annual Report 2013 3
BMO AT A GLANCE
Delivering on Our
Strategic Priorities
2013 Performance
Net Income
$4.2 billion
Adjusted $4.3 billion
Reported net income rose by 1%. Adjusted
net income increased $0.2 billion or 5%.
The bank achieved record revenue, net income
and earnings per share. P 35
Revenue
$16.3 billion
Adjusted $15.6 billion
Reported revenue rose by 1%. Adjusted revenue
increased $0.5 billion or 3%. The increase
was primarily due to revenue growth in Wealth
Management, BMO Capital Markets and
Canadian P&C. P 38
Return on Equity (ROE)
14.9%
Adjusted 15.0%
Reported ROE was 15.9% and adjusted ROE
was 15.5% in 2012. There was an increase in
reported and adjusted earnings available
to common shareholders and higher average
common shareholders’ equity. P 36
Basel III Common Equity Tier 1 Ratio
9.9%
Strong capital position – Our Basel III Common
Equity Tier 1 Ratio of 9.9% is strong and in excess
of regulatory requirements. P 61
2 BMO Financial Group 196th Annual Report 2013
F
inancia
l
Sna
p
s
h
o
t
Re
p
orte
d
Adj
uste
d
1
As at or for the year ended October 3
1
(Canadian
$
in millions, except as noted)
20
1
3
16
,
26
3
58
9
10
,
29
7
4,
248
6.2
6
14.
9%
0
.2
%
9.9%
1,854
596
8
34
1,094
(
130)
4
,248
20
1
2
20
1
2
Revenue (p 38) 16
,
130 15
,
067
Provision for credit losses (p 42) 765 471
Non-interest expense (p 43) 10
,
238 9
,
513
Net income (p 35) 4
,
189 4
,
092
Earnin
g
s per share – diluted ($)
(
p 35
)
6.15 6.00
Return on equity (p 36
)
15.9% 15.5
%
Operatin
g
levera
g
e
(
p 43)
(
1.4
)
%
(
2.8
)%
Basel III Common Equity
Tier 1 Rati
o
2
(p 61) 8.7
%
8.7
%
Net Income by Segmen
t
3
Canadian P&C
(
p 47)
1
,
775
1,785
U
.S. P&C (p 50) 580 644
Wealth Management (p 53) 524
545
BMO Capital Markets (p 56
)
1,021 1,022
Corporate Services
4
(p 59
)
289 9
6
Net
i
ncome (p 35) 4,189 4,092
1
Ad
juste
d
resu
l
ts are non-GAAP an
d
are
d
iscusse
d
in t
h
e Non-GAAP Measures section on page 34.
M
anagement assesses performance on a GAAP basis and on an adjusted basis and considers both
t
o be useful in the assessment of underlying business performance. Presenting results on both
b
ases
p
rovides readers with an enhanced understanding of how management assesses results
.
2 Effective in 2013, regulatory capital requirements for BMO are determined on a Basel III basis.
In 2012, BMO
’
s Basel III capital ratios were calculated on a pro-forma basis
.
3
Certain
p
rior-
y
ear data has been reclassified to conform with the current
y
ear’s
p
resentation.
S
ee pages 44 and 45.
4
Corporate Services, including Technology and Operations
.
20
1
3
1
5
,
572
35
9
9
,
82
6
4,
27
6
6.3
0
1
5
.
0%
0
.1
%
9.9%
1
,864
64
6
8
61
1
,09
6
(
191)
4
,27
6
Bank of Montreal uses a unified branding approach that links the organization’s member companies
under the brand “BMO Financial Group”. Information about the intercorporate relationships among
Bank of Montreal and its principal subsidiaries is provided on page 189, which page is incorporated
herein by reference. These subsidiaries are incorporated under the laws of the state, province or
country in which their head or principal office is located with the exception of: BMO Harris Financial
Advisors, Inc., BMO (US) Lending, LLC, BMO Global Capital Solutions, Inc., BMO Capital Markets Corp.,
BMO Harris Financing, Inc., BMO Financial Corp., BMO Asset Management Corp., psps Holdings, LLC,
and BMO Capital Markets GKST Inc., each of which is incorporated in Delaware.
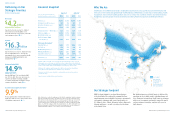
Who We Are
B
MO Financial Grou
p
196th Annual Re
p
ort 201
3
3
Core footprint
Other locations:
Wealth Management
U.S. Personal and
Commercial
BMO Capital Markets
BC
YT
NT
AB
SK
ON
QC
MB
NL
PE
NB
NS
NU
UT
CO
TX
WI
MN
FL
MO
KS
NE
GA
VA
NY MA
WA
OR
CA
IN
IL
AZ
Established in 1817, BMO Financial Group is a highly diversified financial services provider based in North America with
total assets of $537 billion and approximately 45,500 employees. BMO provides a broad range of retail banking, wealth
management and investment banking products and services to more than 12 million customers and conducts business
through three operating groups: Personal and Commercial Banking, Wealth Management and BMO Capital Markets.
Our Strategic Footprint
BMO’s strategic footprint is anchored by our business
in the heartland of the continental economy. Our three
operating groups serve individuals, businesses, governments
and corporate customers right across Canada and in six
U.S. Midwest states – Illinois, Wisconsin, Indiana, Minnesota,
Missouri and Kansas – as well as in other select locations
in the United States.
Our significant presence in North America is bolstered by
operations in select global markets, including Europe and
Asia, allowing us to provide our North American customers
with access to economies and markets around the world,
and our customers from other countries with access to
North America.