Bank of Montreal 2013 Annual Report Download
Download and view the complete annual report
Please find the complete 2013 Bank of Montreal annual report below. You can navigate through the pages in the report by either clicking on the pages listed below, or by using the keyword search tool below to find specific information within the annual report.-
 1
1 -
 2
2 -
 3
3 -
 4
4 -
 5
5 -
 6
6 -
 7
7 -
 8
8 -
 9
9 -
 10
10 -
 11
11 -
 12
12 -
13
-
14
-
15
-
16
-
17
-
18
-
19
-
20
-
21
-
22
-
23
-
24
-
25
-
26
-
27
-
28
-
29
-
30
-
31
-
32
-
33
-
34
-
35
-
36
-
37
-
38
-
39
-
40
-
41
-
42
-
43
-
44
-
45
-
46
-
47
-
48
-
49
-
50
-
51
-
52
-
53
-
54
-
55
-
56
-
57
-
58
-
59
-
60
-
61
-
62
-
63
-
64
-
65
-
66
-
67
-
68
-
69
-
70
-
71
-
72
-
73
-
74
-
75
-
76
-
77
-
78
-
79
-
80
-
81
-
82
-
83
-
84
-
85
-
86
-
87
-
88
-
89
-
90
-
91
-
92
-
93
-
94
-
95
-
96
-
97
-
98
-
99
-
100
-
101
-
102
-
103
-
104
-
105
-
106
-
107
-
108
-
109
-
110
-
111
-
112
-
113
-
114
-
115
-
116
-
117
-
118
-
119
-
120
-
121
-
122
-
123
-
124
-
125
-
126
-
127
-
128
-
129
-
130
-
131
-
132
-
133
-
134
-
135
-
136
-
137
-
138
-
139
-
140
-
141
-
142
-
143
-
144
-
145
-
146
-
147
-
148
-
149
-
150
-
151
-
152
-
153
-
154
-
155
-
156
-
157
-
158
-
159
-
160
-
161
-
162
-
163
-
164
-
165
-
166
-
167
-
168
-
169
-
170
-
171
-
172
-
173
-
174
-
175
-
176
-
177
-
178
-
179
-
180
-
181
-
182
-
183
 |
 |

BMO FINANCIAL GROUP 196TH ANNUAL REPORT 2013
Table of contents
-
Page 1
BMO FINANCIAL GROUP 196TH ANNUAL REPORT 2013 -
Page 2
... Public Accounting Firm 125 Consolidated Financial Statements 130 Notes to Consolidated Financial Statements Resources and Directories 189 190 192 IBC Principal Subsidiaries Glossary of Financial Terms Where to Find More Information Shareholder Information Lillian Ishak, Private Banking, Montreal... -
Page 3
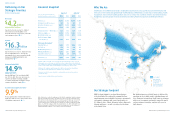
... Services, including Technology and Operations. Core footprint FL Other locations: U.S. Personal and Commercial Wealth Management BMO Capital Markets 9.9% Our Strategic Footprint Bank of Montreal uses a unified branding approach that links the organization's member companies under... -
Page 4
... North American platform to deliver quality earnings growth. Expand strategically in select global markets to create future growth. Ensure our strength in risk management underpins everything we do for our customers. 4 BMO Financial Group 196th Annual Report 2013 BMO Financial... -
Page 5
... 1, 2013, most senior leaders in Canadian Personal and Commercial Banking assumed new roles designed to erase old boundaries and build customer loyalty. Our personal, commercial and wealth businesses throughout North America are now united under the leadership of Chief Operating Officer Frank... -
Page 6
... BMO mobile banking increased 60% in 2013. • Simplifying and automating for greater efficiency. By exploring new ways to streamline processes, modernize platforms and embed cost controls, we're adding to the productivity and efficiency gains realized over the past two years. • Leveraging data... -
Page 7
... Chief Technology & Operations Officer, BMO Financial Group Barbara Muir Corporate Secretary, BMO Financial Group Joanna Rotenberg Chief Marketing Officer and Head of Strategy, BMO Financial Group Mark F. Furlong Group Head, U.S. Personal and Commercial Banking and Chief Executive Officer... -
Page 8
... strength North American commercial loan balances grew by 11% year over year as we continued to meet the needs of businesses across our footprint. Commercial deposits were up 12% in Canada, where we have the second largest market share in business loans of $5 million and less. In the United States... -
Page 9
...of BMO Mutual Funds in Canada increased by a record 38% in 2013, well above the industry growth rate. Our deep understanding of customers' investment goals has also fuelled BMO's leadership in exchange traded funds (ETFs). Since launching our ETF business in 2009, we've achieved a #2 share in Canada... -
Page 10
...Ratio of 9.9% at year-end is strong, and in excess of regulatory requirements. Our consistently strong capital position and prudent approach to risk management help ensure the bank's ï¬nancial strength and ï¬,exibility as we continue to execute on our long-term growth strategy. National governance... -
Page 11
...TSR BMO's one-year total shareholder return (TSR) was the highest among our Canadian peer group in 2013, reï¬,ecting our success in delivering top-tier shareholder returns. Over the past ï¬ve years, BMO shareholders have earned an average annual TSR of 17.0% on their investment in BMO common shares... -
Page 12
... in Governance Award presented by the Canadian Board Diversity Council. We also received the Canadian General Counsel 2013 Social Responsibility Award for our work on sustainability and diversity within the bank and the community. 20 BMO Financial Group 196th Annual Report 2013 BMO... -
Page 13
... O.Ont. Chairman of the Board, BMO Financial Group, and Chair of Torys LLP Board/Committees: Governance and Nominating, Human Resources, Risk Review, The Pension Fund Society of the Bank of Montreal Other public boards: George Weston Limited, Onex Corporation Director since: 2000 Don... -
Page 14
... in 2012 as increases in expenses more than offset revenue growth. The average efficiency ratio for the North American peer group was 62.7%, slightly better than the group's average ratio of 63.0% in 2012, and worse than the average of our Canadian peer group. BMO reported BMO adjusted Canadian peer... -
Page 15
... review of their financial performance for the year and the business environment in which they operate. Summary Personal and Commercial Banking Canadian Personal and Commercial Banking U.S. Personal and Commercial Banking Wealth Management BMO Capital Markets Corporate Services, including Technology... -
Page 16
... wealth management businesses: BMO Nesbitt Burns, BMO InvestorLine, BMO Private Banking, BMO Global Asset Management and BMO Insurance. BMO Capital Markets, our investment and corporate banking and trading products division, provides a full suite of financial products and services to North American... -
Page 17
...our U.S. online banking platform, providing our customers the ability to view and manage all their bank, credit card and investment accounts in one place. After initial release in the market, there were signs of increased total users and average time per visit. o Integrated technology and conference... -
Page 18
... Launched seven new exchange traded funds (ETFs) to help investors build their own portfolios more effectively. o Furthered our commitment to new Canadians with the launch of the BMO NewStart Program, a program that addresses new Canadians' unique deposit, lending, credit card and advice needs. This... -
Page 19
... business in Canada, the United States and other countries. Factors such as the general health of capital and/or credit markets, including liquidity, level of activity, volatility and stability, could have a material impact on our business. As well, interest rates, foreign exchange rates, consumer... -
Page 20
... of our small business, corporate and commercial clients in Canada. A strengthening of the U.S. dollar could increase our risk-weighted assets, lowering our capital ratios. Refer to the Foreign Exchange section on page 38, the Enterprise-Wide Capital Management section on page 61 and the Market Risk... -
Page 21
... Financial Group 196th Annual Report 2013 Canada United States *Forecast Housing market activity should moderate in Canada but strengthen in the United States in 2014. Inflation is expected to rise but still remain low in 2014. Canadian and U.S. Interest Rates (%) Canadian/U.S. Dollar Exchange... -
Page 22
... average annual total shareholder return (TSR) represents the average annual total return earned on an investment in Bank of Montreal common shares made at the beginning of a fixed period. The return includes the change in share price and assumes that dividends received were reinvested in additional... -
Page 23
... cost structure with the current and future business environment as part of a broader effort to improve productivity that is underway. Recognition in net interest income of a portion of the credit mark on the M&I purchased performing loan portfolio. 34 BMO Financial Group 196th Annual Report 2013 -
Page 24
...growth in both the underlying creditor and life insurance businesses. Wealth Management results are discussed in the operating group review on page 53. BMO Capital Markets reported net income increased $73 million or 7% to $1,094 million. Improved results were driven by increases in trading revenues... -
Page 25
... shareholders' equity increased by $2.1 billion from 2012, primarily due to internally-generated capital. Adjusted ROE of 15.0% was in line with our medium-term objective of earning an average annual adjusted ROE of 15% to 18%. BMO has achieved an ROE of 13% or better in 23 of the past 24 years... -
Page 26
... creditor and life insurance businesses. BMO Capital Markets revenues grew, driven by increases in trading revenues and investment banking fees, particularly from our U.S. Platform. U.S. P&C revenue declined as the benefits of strong growth in core commercial and industrial loans and deposits and... -
Page 27
... loan portfolio and income or losses from run-off structured credit activities for 2013, 2012 and 2011; and the hedge of foreign exchange risk on the M&I purchase in 2011, all of which are recorded in Corporate Services, as discussed in the Non-GAAP Measures section on page 34. Canadian P&C revenue... -
Page 28
... year ended October 31 2013 2012 % Average earning assets ($ millions) Change 2013 2012 % Net interest margin (in basis points) 2013 2012 Change Canadian P&C U.S. P&C Personal and Commercial Banking (P&C) Wealth Management BMO Capital Markets Corporate Services, including Technology and Operations... -
Page 29
... fees Deposit and payment service charges Trading revenues Lending fees Card fees Investment management and custodial fees Mutual fund revenues Underwriting and advisory fees Securities gains, other than trading Foreign exchange, other than trading Insurance income Other Total BMO reported Total BMO... -
Page 30
... and credit contracts. Interest and Non-Interest Trading-Related Revenues (1) ($ millions) (taxable equivalent basis) For the year ended October 31 2013 2012 Change from 2012 2011 (%) MD&A Interest rates Foreign exchange Equities Commodities Other (2) Total (teb) Teb offset Total Reported as: Net... -
Page 31
... by Operating Group (1) For the year ended October 31 (Canadian $ in millions) 2013 2012 2011 Canadian P&C U.S. P&C Personal and Commercial Banking Wealth Management BMO Capital Markets Corporate Services, including T&O Impaired real estate loan portfolio Interest on impaired loans Purchased credit... -
Page 32
... Management and BMO Capital Markets. Other employee compensation, which includes salaries, benefits and severance, increased 8% from 2012, due to continued investment in the business, higher benefit costs, including pension, and higher severance and regulatory-related costs. The stronger U.S. dollar... -
Page 33
...page 34. 2013 Review of Operating Groups Performance This section includes an analysis of the financial results of our operating groups and descriptions of their businesses, strategies, strengths, challenges, key value drivers, achievements and outlooks. Personal and Commercial Banking (P&C) (pages... -
Page 34
... Assets by Operating Group and by Location Personal and Commercial Banking For the year ended October 31 2013 2012 2011 Wealth Management 2013 2012 2011 BMO Capital Markets 2013 2012 2011 ($ millions, except as noted) Total Consolidated 2013 2012 2011 Corporate Services, including Technology... -
Page 35
...(teb) (%) Operating leverage (teb) (%) Adjusted efficiency ratio (teb) (%) Efficiency ratio (teb) (%) Net interest margin on earning assets (teb) (%) Average common equity Average earning assets Average loans and acceptances Average deposits Assets under administration Full-time equivalent employees... -
Page 36
... efficiency ratio at a stable level in a low revenue growth environment by tightly managing expenses. 2014 Focus ‰ Continue the redesign of our core processes and implement new technologies to improve productivity and enhance the customer experience. BMO Financial Group 196th Annual Report 2013... -
Page 37
... a focus for Canadian P&C in 2014. We expect productivity to improve as balance growth continues, margin compression subsides and the benefits from productivity initiatives are realized, including mortgage and commercial lending process improvements. 48 BMO Financial Group 196th Annual Report 2013 -
Page 38
... well as in response to a strengthening U.S. economy. In the Canadian personal banking sector, retail operating deposits are projected to grow in 2014 by approximately 5%, similar to growth in 2013 and in line with the expected increase in personal income. Credit card loan balances grew nominally in... -
Page 39
...additional digital channels and improved mortgage and business lending and treasury processes. Improve financial performance by growing revenue and effectively managing costs 2013 Achievements ‰ Revenue from strong core commercial and industrial loan growth and increased deposit balances improved... -
Page 40
... acquired loan portfolios and deposit balances, and lower deposit and debit card fees. During the year we continued to execute our lower-cost funding strategy, and we have reduced the number of higher-cost time deposits and money market accounts, in favour of growth in lower-cost chequing and... -
Page 41
MANAGEMENT'S DISCUSSION AND ANALYSIS Average deposits of $59.3 billion increased slightly from the prior year, as growth in our commercial business and in our personal chequing and savings accounts more than offset a planned reduction in higher-cost personal money market and time deposit accounts.... -
Page 42
... to mass affluent clients in the United States. BMO Global Asset Management is a global investment organization that provides investment management, retirement, and trust and custody services to institutional, retail and high net worth investors around the world. BMO Insurance operates in Canada and... -
Page 43
....3 2013 Revenue by Line of Business (%) BMO Nesbitt Burns 33% BMO Insurance 13% BMO Global Asset Management 23% BMO's Private Banking Businesses 25% 2011 2012 2013 2011 2012 2013 BMO InvestorLine 6% MD&A Invest in our people, products, technology and footprint to drive future growth 2013... -
Page 44
... an increase in transaction volumes throughout the year and strong client asset growth, attributable to market gains and new client acquisition. Historically low interest rates limited our net interest income growth. In 2014, we anticipate that a sustained healthy level of activity in equity markets... -
Page 45
..., including 16 offices in North America. Tom Milroy Group Head BMO Capital Markets MD&A Lines of Business Investment and Corporate Banking offers clients debt and equity capital-raising services, as well as a full range of loan and debt products, balance sheet management solutions and treasury... -
Page 46
... and Drivers Trading Products revenue Investment and Corporate Banking revenue Net income growth (%) Revenue growth (%) Net economic profit Return on equity (%) Operating leverage (%) Efficiency ratio (teb) (%) Average common equity Average assets Average loans and acceptances Average deposits Debt... -
Page 47
...Capital Markets' strong performance in fiscal 2013 reflects our balanced, diversified and client-focused business model, as well as our disciplined approach to risk management in an environment influenced by market factors that contribute to variability in results. There was growth in our investment... -
Page 48
...including strategic planning, risk management, finance, legal and compliance, marketing, communications and human resources. T&O manages, maintains and provides governance over information technology, operations services, real estate and sourcing for BMO Financial Group. The costs of Corporate Units... -
Page 49
...levels of wholesale deposits. Further details on the composition of deposits are provided in Note 15 on page 158 of the financial statements and in the Liquidity and Funding Risk section on page 92. Residential mortgages Consumer instalment and other personal Credit cards Businesses and governments... -
Page 50
... credit ratings; ‰ underpins our operating groups' business strategies; and ‰ supports depositor, investor and regulatory confidence while also building long-term shareholder value. Capital Demand Capital required to support the risks underlying our business activities Capital Supply Capital... -
Page 51
... basis. In 2013, the minimum Basel III capital ratios proposed by the Basel Committee on Banking Supervision (BCBS) were a 3.5% Common Equity Tier 1 (CET1) Ratio, 4.5% Tier 1 Capital Ratio and 8% Total Capital Ratio, such ratios being calculated using a five-year transitional phase-in of regulatory... -
Page 52
... total value as at that date. The cap reduces by one-tenth in each subsequent year. Under Basel III, BMO's existing preferred shares, innovative Tier 1 capital (BMO Capital Trust Securities and BMO Tier 1 Notes) and Tier 2 subordinated debt instruments do not BMO Financial Group 196th Annual Report... -
Page 53
... is calculated for various types of risk - credit, market (trading and non-trading), operational and business - based on a one-year time horizon. Economic capital is a key element of our risk-based capital management and ICAAP framework. MD&A Economic Capital and RWA by Operating Group and Risk... -
Page 54
... growth, fund strategic investments and provide continued support for depositors. At year end, BMO's common shares provided a 4.0% annual dividend yield based on the year-end closing share price and dividends declared in the last four quarters. On December 3, 2013, BMO announced that the Board... -
Page 55
...the financial statements. There were no mortgage loans with subprime or Alt-A characteristics held in any of the customer securitization vehicles at year end. No losses have been recorded on any of BMO's exposures to these vehicles. BMO's investment in the ABCP of the market-funded vehicles totalled... -
Page 56
... loans and trade finance. Amounts are net of write-offs and gross of specific allowances, both of which are not considered material. (2) Securities includes cash products, insurance investments and traded credit. Gross traded credit includes only the long positions and excludes offsetting short... -
Page 57
MANAGEMENT'S DISCUSSION AND ANALYSIS Credit Default Swaps by Country and Credit Quality (Canadian $ in millions) As at October 31, 2013 Purchased Country Fair value Written Purchased Notional Written Investment Non-Investment Total grade grade Total Total exposure Investment Non-Investment ... -
Page 58
... the U.S. operations of non-U.S. banks, such as BMO. The Proposed Rule would establish new requirements relating to risk-based capital, leverage limits, liquidity standards, risk-management frameworks, concentration and credit exposure limits, resolution planning and credit exposure reporting. The... -
Page 59
... performing loans or purchased credit impaired loans (PCI loans), both of which were recorded at fair value at the time of acquisition. The determination of fair value involved estimating the expected cash flows to be received and determining the 70 BMO Financial Group 196th Annual Report 2013 -
Page 60
.... We determine discount rates at each year end for our Canadian and U.S. plans using high-quality corporate bonds with terms matching the plans' specific cash flows. Additional information regarding our accounting for pension and other employee future benefits, including a sensitivity analysis for... -
Page 61
... in market rates, if future contractual cash flows associated with the debt security are still expected to be recovered. At the end of 2013, there were total unrealized losses of $96 million on securities for which cost exceeded fair value and an impairment write-down had not been recorded. Of... -
Page 62
...Note 27 on page 177 of the financial statements. A select suite of customer loan and mortgage products is offered to our employees at rates normally made available to our preferred customers. We also offer employees a subsidy on annual credit card fees. MD&A BMO Financial Group 196th Annual Report... -
Page 63
... control over financial reporting. Shareholders' Auditors' Services and Fees Pre-Approval Policies and Procedures As part of BMO Financial Group's corporate governance practices, the Board of Directors oversees the strict application of BMO's corporate policy limiting the services provided by... -
Page 64
... Financial Information: Wholesale and retail credit exposures by internal rating grades are provided on page 46. 8 Describe the use of stress testing within the bank's risk governance and capital frameworks. Annual Report: BMO's stress testing process is described on page 82. 16 Present a flow... -
Page 65
... in Note 30 on pages 185 to 188 of the financial statements. 30 Provide a discussion of credit risk mitigation. Annual Report: A discussion of BMO's collateral management is provided on page 84. 21 Discuss the bank's sources of funding and describe the bank's funding strategy. Annual Report: BMO... -
Page 66
... lower year over year, reflecting lower levels in both Canada and the United States. *Excludes purchased credit impaired loans. The total provision for credit losses was lower year over year, reflecting lower provisions across our consumer and commercial loan portfolios and all our operating groups... -
Page 67
... Portfolio Management (ERPM) group develops our risk appetite, risk policies and limits, and provides independent review and oversight across the enterprise on risk-related issues to achieve prudent and measured risk-taking that aligns with our business strategy. Canadian Household Debt High levels... -
Page 68
...wholesale funding, as well as guidelines approved by senior management related to liability diversification, financial condition, and credit and liquidity exposure appetite; and ‰ Insurance Risk - limits on policy exposure and reinsurance arrangements. BMO Financial Group 196th Annual Report 2013... -
Page 69
... Board of Directors Board Risk Review Committee Board Audit and Conduct Review Committee Risk Management Committee Balance Sheet and Capital Management Reputation Risk Management Chief Executive Officer Operational Risk MD&A Operating Groups First Line of Defence Enterprise Risk and Portfolio... -
Page 70
...credit risk and transactional and position limits for market risk. Structured transactions - New structured products and transactions with significant reputation, legal, accounting, regulatory or tax risk are reviewed by the Reputation Risk Management Committee or the Trading Products Risk Committee... -
Page 71
... limits. Credit decision-making is conducted at the management level appropriate to the size and risk of each transaction in accordance with comprehensive corporate policies, standards and procedures governing the conduct of credit risk activities. 82 BMO Financial Group 196th Annual Report 2013... -
Page 72
... portfolio comprised of millions of clients, the majority of them consumers and small to medium-sized businesses. BMO employs a number of measures to mitigate and manage credit risk. These measures include, but are not limited to, strong underwriting BMO Financial Group 196th Annual Report 2013... -
Page 73
... trade Residential mortgages - Canada Residential mortgages - U.S. Credit cards Personal loans - Canada Personal loans - U.S. Commercial mortgages Commercial real estate Construction MD&A Details related to our credit exposures are discussed in Note 4, on page 137 of the financial statements... -
Page 74
... of the financial statements. Changes in Allowance for Credit Losses (1) ($ millions, except as noted) For the year ended October 31 2013 2012 MD&A (1) GIL excludes purchased credit impaired loans. (2) Ratio is presented excluding purchased portfolios, to provide for better historical comparisons... -
Page 75
... (Canadian $ in millions) As at October 31 Non-centrally cleared 2013 2012 Centrally cleared 2013 2012 Total 2013 2012 Interest Rate Contracts Swaps Forward rate agreements Purchased options Written options Total interest rate contracts Foreign Exchange Contracts Cross-currency swaps Cross-currency... -
Page 76
... of risk in BMO's trading and underwriting activities: interest rate, foreign exchange rate, credit spreads, equity and commodity prices and their implied volatilities, where model inputs are calibrated to historical data from a period of significant financial stress. This measure calculates the... -
Page 77
... adjustment is recorded in accordance with our accounting policy and regulatory requirements. Prior to the final month-end general ledger close, meetings are held between key stakeholders from the lines of business, Market Risk, Capital Markets Finance and the Chief Accountant's Group to review all... -
Page 78
...-year period. Total Trading Value at Risk (VaR) Summary ($ millions)* For the year ended October 31, 2013 (pre-tax Canadian equivalent) Year-end Average High As at Oct. 31, 2012 Low Commodity VaR Equity VaR Foreign exchange VaR Interest rate VaR Credit VaR Diversification Total trading VaR Total... -
Page 79
... 3 30 No v'1 2 31 Au g' 13 31 Ma r'1 3 31 De c'1 2 30 Se p' 13 eb '1 3 30 Ap r'1 3 1N ov '1 2 un '1 3 an '1 3 ul' 13 28 F Interest rate Commodity Credit Total trading Equity Total AFS Foreign exchange 90 BMO Financial Group 196th Annual Report 2013 31 O 31 J 30 J 31 J c t' 13 -
Page 80
... 35 37 Daily net revenues (pre-tax) Structural Market Risk Structural market risk is comprised of interest rate risk arising from our banking activities (loans and deposits) and foreign exchange risk arising from our foreign currency operations. Structural market risk is managed in support of high... -
Page 81
... risk in the market or specific to BMO. The RRC oversees liquidity and funding risk and annually approves applicable policies, limits and the contingency plan, and regularly reviews liquidity and funding positions. The RMC and Balance Sheet and Capital Management Committee provide senior management... -
Page 82
... to reductions reflecting management's view of the liquidity value of those assets in a stress scenario. Liquid assets in the trading business include cash on deposit with central banks and short-term deposits with other financial institutions, highly-rated debt and equity securities and shortterm... -
Page 83
... Funding Risk Management Framework, a Pledging of Assets corporate policy is in place that sets out the framework and pledging limits for financial and non-financial assets. See Table 5 on page 107 for more information on BMO's liquid assets, encumbered assets and net unencumbered assets. See Note... -
Page 84
... insurance strategies and policies. ERPM is responsible for providing risk management direction and independent oversight to these insurance companies. This group also has the authority to approve activities that exceed the authorities and limits BMO Financial Group 196th Annual Report 2013... -
Page 85
... that value complex transactions or involve sophisticated portfolio and capital management methodologies. These models are used to inform strategic decision-making and to assist in making daily lending, trading, under96 BMO Financial Group 196th Annual Report 2013 writing, funding, investment and... -
Page 86
..., allocating capital and managing regulatory capital and Economic Capital; ‰ fiduciary models for asset allocation, asset optimization and portfolio management; ‰ major business strategy models to forecast the possible outcomes of new strategies in support of our business decision-making process... -
Page 87
...in client loyalty, litigation, regulatory sanction or additional oversight or decline in BMO's share price. BMO's reputation is one of its most valuable assets. By protecting and maintaining our reputation, we can increase shareholder value, reduce our cost of capital and improve employee engagement... -
Page 88
... Report and Public Accountability Statement, and on our Corporate Responsibility website. Our Environmental, Social and Governance Report also reports on our environmental and social performance according to the Global Reporting Initiative. MD&A BMO Financial Group 196th Annual Report 2013... -
Page 89
... U.S. dollar increased revenue by $21 million. Provisions for credit losses were $26 million lower in 2012. Non-interest expense increased $60 million or 3% to $1,956 million, primarily due to increases in employee costs and technology investments. Corporate Services net income for the year was... -
Page 90
... Wealth Management and higher mutual fund revenues, partially offset by lower trading revenues in BMO Capital Markets. Most other types of non-interest revenue were also up, with the exception of insurance income, card fees and other. The stronger U.S. dollar increased non-interest revenue growth by... -
Page 91
... in exchange rates in 2012 and 2013 have been subdued. A stronger U.S. dollar increases the translated value of U.S.-dollardenominated revenues, expenses, provisions for credit losses, income taxes and net income. The effective income tax rate can vary, as it depends on the timing of resolution... -
Page 92
... Personal and Commercial Banking Wealth Management BMO Capital Markets Corporate Services, including T&O BMO Financial Group adjusted net income Information per Common Share ($) Dividends declared Earnings Basic Diluted Adjusted earnings Basic Diluted Book value Market price High Low Close Financial... -
Page 93
...) Total Shareholder Return (%) Five-year average annual return Three-year average annual return One-year return Common Share Information Number outstanding (in thousands) End of year Average basic Average diluted Number of shareholder accounts Book value per share ($) Total market value of shares... -
Page 94
... 2: Summary Income Statement and Growth Statistics For the year ended October 31 2013 2012 2011 ($ millions, except as noted) 5-year CAGR 10-year CAGR 2010 2009 Income Statement - Reported Results Net interest income Non-interest revenue Total revenue Provision for credit losses Non-interest... -
Page 95
SUPPLEMENTAL INFORMATION Table 3: Returns on Equity and Assets For the year ended October 31 2013 2012 ($ millions, except as noted) 2011 2010 2009 2008 2007 2006 2005 2004 Reported net income Attributable to non-controlling interest in subsidiaries (1) Preferred dividends Reported net income ... -
Page 96
...Other Information Employees (1) Canada United States Other Total Bank branches Canada United States Other Total Automated banking machines Canada United States Total Rates Average Canadian prime rate (%) Average U.S. prime rate (%) Canadian/U.S. dollar exchange rates ($) High Low Average End of year... -
Page 97
... margin (%) Canadian dollar net interest margin (%) U.S. dollar and other currencies net interest margin (%) Non-Interest Revenue Securities commissions and fees Deposit and payment service charges Trading revenues Lending fees Card fees Investment management and custodial fees Mutual fund revenues... -
Page 98
...Revenue Ratio For the year ended October 31 2013 2012 2011 2010 ($ millions, except as noted) 5-year CAGR 10-year CAGR 2009 Non-Interest Expense Employee compensation Salaries Performance-based compensation Employee benefits Total employee compensation Premises and equipment Rental of real estate... -
Page 99
... balances Average interest rate (%) 2011 Interest income/ expense Assets Canadian Dollar Deposits with other banks Securities Securities borrowed or purchased under resale agreements Loans Residential mortgages Non-residential mortgages Consumer instalment and other personal Credit cards Businesses... -
Page 100
... year ended October 31 Average balance Average rate Total Average balance ($ millions) 2012/2011 Increase (decrease) due to change in Average rate Total Assets Canadian Dollar Deposits with other banks Securities Securities borrowed or purchased under resale agreements Loans Residential mortgages... -
Page 101
... Information Canada As at October 31 2013 2012 2011 2010 2009 ($ millions) (6) United States 2013 2012 2011 2010 2009 2013 Other countries 2012 2011 2010 2009 Consumer Residential mortgages Credit cards Consumer instalment and other personal loans Total consumer Total businesses and governments... -
Page 102
... in Canada Net Businesses and Governments Loans by Industry Commercial mortgages Commercial real estate Construction (non-real estate) Retail trade Wholesale trade Agriculture Communications Manufacturing Mining Oil and gas Transportation Utilities Forest products Service industries Financial... -
Page 103
... Information ($ millions) Canada As at October 31 2013 2012 2011 2010 2009 2013 2012 United States 2011 2010 2009 2013 Other countries 2012 2011 2010 2009 Gross impaired loans and acceptances (GIL), beginning of year Consumer Businesses and governments Total GIL, beginning of year Additions... -
Page 104
Total 2013 2012 ...Information 1,050 1,494 2,544 984 1,992 2,976 759 1,926 2,685 721 2,173 2,894 611 2,686 3,297 0.63 1.32 0.91 7.61 0.64 1.95 1.17 9.30 0.53 1.99 1.12 8.98 0.71 2.80 1.62 12.18 0.67 3.43 1.94 14.92 4.86 6.18 8.36 12.18 14.92 BMO Financial Group 196th Annual Report 2013... -
Page 105
...Information ($ millions, except as noted) Canada As at October 31 2013 2012 2011 2010 2009 2013 2012 United States 2011 2010 2009 2013 Other countries 2012 2011 2010 2009 Consumer Residential mortgages Consumer instalment and other personal loans Total consumer Businesses and government Off-balance... -
Page 106
...60 0.60 - (101) Supplemental Information (101) 368 1,534 1,902 (685) (807) 104 41 0.70 0.70 (856) (1,056) (443) (538) 176 596 0.20 0.30 216 630 0.30 0.43 Total 2013 2012 2011 2010 2009 79 71 150 ....2 57.7 13.7 19.1 108.2 83.7 74.5 64.9 57.7 BMO Financial Group 196th Annual Report 2013 117 -
Page 107
... Information For the year ended October 31 ($ millions) 2013 2012 2011 2010 2009 Consumer Residential mortgages Cards Consumer instalment and other personal loans Total consumer Businesses and Governments Commercial mortgages Commercial real estate Construction (non-real estate) Retail trade... -
Page 108
... loans and trade finance. Amounts are net of write-offs and gross of specific allowances, both of which are not considered material. (3) Securities include cash products, insurance investments and traded credit. Gross traded credit includes only the long positions and excludes offsetting short... -
Page 109
... subject to phase-out Collective allowances Total regulatory adjustments to Tier 2 capital Tier 2 capital (T2) Total capital (TC = T1 + T2) 12,318 15,224 602 (4,910) (2,007) 21,227 3,770 11 11 (409) 3,372 24,599 4,444 176 176 331 (50) 4,901 29,500 120 BMO Financial Group 196th Annual Report 2013 -
Page 110
... cost Fair value (1) 2013 2012 2011 ($ millions) Unrealized gains (losses) (2) 2010 2009 Canadian governments debt U.S. governments debt Mortgage-backed securities - Canada Mortgage backed securities - United States Corporate debt Corporate equity Other governments debt Total available-for-sale... -
Page 111
... written communication of our policies and procedures governing corporate conduct and risk management; comprehensive business planning; effective segregation of duties; delegation of authority and personal accountability; escalation of relevant information for decisions regarding public disclosure... -
Page 112
..."), and our report dated December 3, 2013 expressed an unmodified (unqualified) opinion on the effectiveness of the bank's internal control over financial reporting. Chartered Accountants, Licensed Public Accountants December 3, 2013 Toronto, Canada BMO Financial Group 196th Annual Report 2013 123 -
Page 113
...Public Company Accounting Oversight Board (United States), the consolidated balance sheets of the bank as at October 31, 2013 and 2012, the consolidated statements of income, comprehensive income, changes in equity, and cash flows for each of the years in the three-year period ended October 31, 2013... -
Page 114
...Securities commissions and fees Deposit and payment service charges Trading revenues Lending fees Card fees Investment management and custodial fees Mutual fund revenues Underwriting and advisory fees Securities gains, other than trading (Note 3) Foreign exchange, other than trading Insurance income... -
Page 115
.... (5) Net of income tax (provision) recovery of $146 million, $13 million and $(26) million for the years ended, respectively. The accompanying notes are an integral part of these consolidated financial statements. Consolidated Financial Statements 126 BMO Financial Group 196th Annual Report 2013 -
Page 116
... (Note 20) Total Equity Total Liabilities and Equity The accompanying notes are an integral part of these consolidated financial statements. 525,449 Certain comparative figures have been reclassified to conform with the current year's presentation. BMO Financial Group 196th Annual Report 2013 127 -
Page 117
...Canadian $ in millions) 2013 2012 2011 Preferred Shares (Note 20) Balance at beginning of year Issued during the year Redeemed during the year Balance at End of Year Common Shares (Note 20) Balance at beginning of year Issued under the Shareholder Dividend Reinvestment and Share Purchase Plan (Note... -
Page 118
... Statement of Cash Flows For the Year Ended October 31 (Canadian $ in millions) 2013 2012 2011 Cash Flows from Operating Activities Net Income Adjustments to determine net cash flows provided by (used in) operating activities Impairment write-down of securities, other than trading (Note 3) Net... -
Page 119
... assets and liabilities not measured at fair value are translated into Canadian dollars at historical rates. Revenues and expenses denominated in foreign currencies are translated using the average exchange rate for the year. Unrealized gains and losses arising from translating our net investment... -
Page 120
... discount rates at each year end for our Canadian and U.S. plans using high-quality corporate bonds with terms matching the plans' specific cash flows. Additional information regarding our accounting for pension and other employee future benefits is included in Note 23. Allowance for credit losses... -
Page 121
... using the Canadian Asset Liability Method, which incorporates best-estimate assumptions for mortality, morbidity, policy lapses, surrenders, future investment yields, policy dividends, administration costs and margins for adverse deviation. These 132 BMO Financial Group 196th Annual Report 2013 -
Page 122
... standard for accounting for financial instruments. The new standard specifies that financial assets are to be measured at either amortized cost or fair value on the basis of the reporting entity's business model for managing the financial assets and the contractual cash flow characteristics of... -
Page 123
...value of estimated future cash flows discounted at the asset's original effective interest rate. If there is objective evidence of impairment, a write-down is recorded in our Consolidated Statement of Income in securities gains, other than trading. Notes 134 BMO Financial Group 196th Annual Report... -
Page 124
...is considered to be fair value. Quoted market value is based on bid prices. For securities where market quotes are not available, we use estimation techniques to determine fair value. Discussion of fair value measurement is included in Note 29. Notes BMO Financial Group 196th Annual Report 2013 135 -
Page 125
... FINANCIAL STATEMENTS (Canadian $ in millions, except as noted) Within 1 year Term to maturity 1 to 3 years 3 to 5 years 5 to 10 years Over 10 years 2013 Total 2012 Total Trading Securities Issued or guaranteed by: Canadian federal government Canadian provincial and municipal governments... -
Page 126
...insurance operations: Trading securities, net realized and unrealized gains (losses) of $(190) million for the year ended October 31, 2013 ($286 million in 2012 and $6.5 million in 2011). Note 4: Loans, Customers' Liability under Acceptances and Allowance for Credit Losses Loans Loans are initially... -
Page 127
... residential mortgages if guaranteed by the Government of Canada. Credit card loans are immediately written off when principal or interest payments are 180 days past due, and are not reported as impaired. In Canada, consumer installment loans, other personal loans and some small business loans are... -
Page 128
... 2013 2012 Residential mortgages Consumer instalment and other personal loans Business and government loans Total (1) By geographic region (2): Canada United States Other countries Total (1) Excludes purchased credit impaired loans. (2) Geographic region is based upon the country of ultimate risk... -
Page 129
... are as follows: Credit card, consumer instalment and other personal loans 2013 2012 Business and government loans (2) 2013 2012 (Canadian $ in millions) For the year ended October 31 Residential mortgages 2013 2012 Total 2013 2012 By geographic region (1): Canada United States Other countries... -
Page 130
... to these performing loans will be recorded as they arise in a manner that is consistent with our accounting policy for loans we originate. The total specific provision for credit losses for purchased performing loans for the year ended October 31, 2013 was $240 million ($291 million in 2012 and $19... -
Page 131
...: (Canadian $ in millions) Drawn 2013 2012 Commitments (undrawn) 2013 2012 OTC derivatives 2013 2012 Other off-balance sheet items 2013 2012 Repo-style transactions 2013 2012 Total 2013 2012 Financial institutions Governments Manufacturing Real estate Retail trade Service industries Wholesale trade... -
Page 132
..., foreign exchange rates, equity and commodity prices and their implied volatilities, and credit spreads, as well as the risk of credit migration and default. We incur market risk in our trading and underwriting activities and in the management of structural market risk in our banking and insurance... -
Page 133
... can be several years. The maximum amount payable under these backstop and other liquidity facilities totalled $4,512 million as at October 31, 2013 ($4,467 million in 2012). As at October 31, 2013, $145 million was 144 BMO Financial Group 196th Annual Report 2013 Notes Indemnification Agreements... -
Page 134
... and fees collected, net of the yield paid to investors is recorded in net interest income using the effective interest method over the term of the securitization. Credit losses associated with the loans are recorded in the provision for credit losses. During the year ended October 31, 2013, we... -
Page 135
... Canadian customer securitization vehicles U.S. customer Credit Structured securitization protection investment vehicles vehicle vehicle 2012 Capital and funding vehicles (3) On-balance sheet assets at carrying value Cash and cash equivalents Trading securities Available-for-sale securities Loans... -
Page 136
... our behalf. See Note 1 and Note 18 for further information related to the Capital Trusts. Bank Securitization Vehicle We use a bank securitization vehicle to securitize our Canadian credit card loans in order to obtain alternate sources of funding. The structure of this vehicle limits the types of... -
Page 137
... funding rates. The main risks associated with these instruments are related to exposure to movements in interest rates, foreign exchange rates, credit quality, securities values or commodities prices, as applicable, and the possible inability of counterparties to meet the terms of the contracts... -
Page 138
..., amounts are included in the Consolidated Statement of Income in foreign exchange, other than trading. There was no hedge ineffectiveness associated with net investment hedges for the years ended October 31, 2013 and 2012. We use foreign currency deposits with a term to maturity of zero to three... -
Page 139
...foreign exchange contracts to interest expense Contract type Fair value change recorded in other comprehensive income Fair value change recorded in non-interest revenue - other 2013 Interest rate Foreign exchange Total 2012 Interest rate Foreign exchange Total 2011 Interest rate Foreign exchange... -
Page 140
... Balance Sheet are as follows: (Canadian $ in millions) 2013 Assets 2012 Liabilities 2013 2012 Fair value of trading derivatives Fair value of hedging derivatives Total 29,484 775 30,259 46,575 1,496 48,071 31,184 790 31,974 48,163 573 48,736 Notes BMO Financial Group 196th Annual Report 2013... -
Page 141
...be exchanged under the contract. Notional amounts do not represent assets or liabilities and therefore are not recorded in our Consolidated Balance Sheet. (Canadian $ in millions) Hedging Trading Cash flow Fair value Total Trading 2013 Hedging Cash flow Fair value Total 2012 Interest Rate Contracts... -
Page 142
...Canadian $ in millions) 2013 Replacement cost Credit risk equivalent Riskweighted assets Replacement cost Credit risk equivalent 2012 Riskweighted assets Interest Rate Contracts Swaps Forward rate agreements Purchased options Total interest rate contracts Foreign Exchange Contracts Cross-currency... -
Page 143
...: As at October 31, 2013 (Canadian $ in millions) Interest rate contracts Foreign exchange contracts Commodity contracts Equity contracts Credit default swaps Total Financial institutions Governments Natural resources Energy Other Total As at October 31, 2012 (Canadian $ in millions) 18,212... -
Page 144
... over 10 years. Aver is part of our Canadian Personal and Commercial Banking reporting segment. The acquisition was accounted for as a business combination. BMO Financial Group 196th Annual Report 2013 155 Notes Aver Media LP ("Aver") On April 1, 2013, we completed the acquisition of the assets of... -
Page 145
...CGU. The cost of capital for each CGU was estimated using the Capital Asset Pricing Model, based on the historical betas of publicly traded peer companies that are comparable to the CGU. There were no write-downs of goodwill due to impairment during the years ended October 31, 2013 and 2012. The key... -
Page 146
...the years ended October 31, 2013 and 2012 is as follows: (Canadian $ in millions) Canadian P&C U.S. P&C Personal and Commercial Banking Client Investing Global Asset* Management Private Banking Wealth Management BMO Capital Markets Corporate Services Technology and Operations Total Total Insurance... -
Page 147
... on demand (Canadian $ in millions) Interest bearing 2013 2012 Non-interest bearing 2013 2012 Payable after notice 2013 2012 Payable on a fixed date 2013 2012 Total 2013 2012 Deposits by: Banks Businesses and governments Individuals Total (1) (2) Booked in: Canada United States Other countries... -
Page 148
... value, which better aligns the accounting result with the way the portfolio is managed. The change in fair value of these structured notes was recorded as an increase in non-interest revenue, trading revenues of $5 million for the year ended October 31, 2013 (increase of $19 million in 2012). This... -
Page 149
... assumptions on policy benefit liabilities was not material during the years ended October 31, 2013 or 2012. Reinsurance In the ordinary course of business, our insurance subsidiaries reinsure risks to other insurance and reinsurance companies in order to provide greater diversification, limit loss... -
Page 150
...and forecasted trends in balances. Capital Common shareholders' equity is reported as non-interest sensitive. Yields Yields are based upon the effective interest rates for the assets or liabilities on October 31, 2013. BMO Financial Group 196th Annual Report 2013 161 Notes Assets Fixed rate, fixed... -
Page 151
...debt, Capital trust securities and preferred share liability Total equity Total liabilities and shareholders' equity Asset/liability gap position Notional amounts of derivatives Total interest rate gap position - 2013 Canadian dollar Foreign currency Total Gap Total interest rate gap position - 2012... -
Page 152
... 5-year market rates plus a predetermined spread, established at each redemption date. The Series 17 Preferred shares carry a non-cumulative quarterly dividend based on BMO Financial Group 196th Annual Report 2013 163 Notes Preferred Share Rights and Privileges Class B - Series 5 shares were... -
Page 153
... common shares at an average of the closing price of our common shares on the Toronto Stock Exchange based on the five trading days prior to the last business day of the month or we may purchase them on the open market at market prices. During the year ended October 31, 2013, we issued a total of... -
Page 154
... targeted credit ratings; underpins our operating groups' business strategies; and builds depositor confidence and long-term shareholder value. Our approach includes establishing limits, targets and performance measures for the management of balance sheet positions, risk levels and minimum capital... -
Page 155
... implied volatility for traded options on our common shares. The risk-free rate is based on the yields of a Canadian swap curve with maturities similar to the expected period until exercise of the options. The weighted-average exercise price on the 166 BMO Financial Group 196th Annual Report 2013 -
Page 156
...compensation increase, retirement age, mortality and health care cost trend rates. The discount rates for the main Canadian and U.S. pension and other employee future benefit plans were selected using high-quality corporate bonds with terms matching the plans' cash flows. Notes BMO Financial Group... -
Page 157
... exposures and interest rate risk within policy limits. Notes Risk Management The plans are exposed to various risks, including market risk (interest rate, equity and foreign currency risks), credit risk, operational risk, surplus risk and longevity risk. We follow a number of approaches to... -
Page 158
...and target asset allocations of the plans, based on the fair market values at October 31, are as follows: Pension benefit plans Target 2013 Actual 2013 Actual 2012 Actual 2011 Target 2013 Other employee future benefit plans Actual 2013 Actual 2012 Actual 2011 Equities Fixed income investments Other... -
Page 159
... the year ended October 31, 2013 ($4 million in 2012) to us and certain of our subsidiaries for investment management, record-keeping, custodial and administrative services rendered on the same terms that we offer to our customers for these services. The plans did not hold any of our shares directly... -
Page 160
... and remaining at that level thereafter. Cash Flows Cash payments we made during the year in connection with our employee future benefit plans are as follows: (Canadian $ in millions) 2013 Pension benefit plans 2012 2011 Other employee future benefit plans 2013 2012 2011 Contributions to defined... -
Page 161
..., branches, associates and interests in joint ventures for which deferred tax liabilities have not been recognized is $20 billion as at October 31, 2013 ($18 billion in 2012). Components of Deferred Income Tax Balances (Canadian $ in millions) Allowance for credit losses Employee future benefits... -
Page 162
...that we have recorded in our Consolidated Statement of Income: (Canadian $ in millions, except as noted) 2013 2012 2011 Combined Canadian federal and provincial income taxes at the statutory tax rate Increase (decrease) resulting from: Tax-exempt income from securities Foreign operations subject to... -
Page 163
... our mortgage specialists and financial planners. Personal banking provides financial solutions for everyday banking, financing, investing, credit cards and creditor insurance needs. Commercial banking provides our small business, medium-sized Notes 174 BMO Financial Group 196th Annual Report 2013 -
Page 164
...including strategic planning, risk management, finance, legal and compliance, marketing, communications and human resources. T&O manages, maintains and provides governance over information technology, operations services, real estate and sourcing for BMO Financial Group. The costs of Corporate Units... -
Page 165
NOTES TO CONSOLIDATED FINANCIAL STATEMENTS Our results and average assets, grouped by operating segment and geographic region, are as follows: (Canadian $ in millions) Canadian P&C U.S. P&C Wealth Management BMO CM Corporate Services (1) Total Canada United States Other countries 2013 (2) Net ... -
Page 166
... shares (purchased on the open market) or deferred share units until such time Employees A select suite of customer loan and mortgage products is offered to employees at rates normally accorded to preferred customers. We also offer employees a fee-based subsidy on annual credit card fees. Note... -
Page 167
... equity funds and investments in equity and debt securities at market value at the time the commitments are drawn. In addition, we act as underwriter for certain new issuances under which we alone or together with a syndicate of financial institutions purchase the new issue for resale to investors... -
Page 168
... using a market or income approach. These models consider various factors, including projected cash flows, earnings, revenue and other third-party evidence as available. The fair value of limited partnership investments is based upon net asset values published by third-party fund managers. Prices... -
Page 169
... Fair value 2012 Fair value over (under) book value Assets Cash and cash equivalents Interest bearing deposits with banks Securities Securities borrowed or purchased under resale agreements Loans Residential mortgages Consumer instalment and other personal Credit cards Businesses and governments... -
Page 170
... mortgage obligations Corporate debt Corporate equity Other Securities Fair Value Liabilities Securities sold but not yet purchased Structured note liabilities and other note liabilities Annuity liabilities Derivative Assets Interest rate contracts Foreign exchange contracts Commodity contracts... -
Page 171
... for these securities during the year. During the year ended October 31, 2012, derivative liabilities of $9 million were transferred from Level 3 to Level 2, as market information became available for certain over-the-counter equity contracts. Notes 182 BMO Financial Group 196th Annual Report 2013 -
Page 172
... 31, 2013 (Canadian $ in millions) Balance, October 31, 2012 Included in earnings Purchases Sales Transfers into Maturities (1) Level 3 Transfers out of Level 3 Unrealized gains (losses) (2) Trading Securities Issued or guaranteed by: Canadian provincial and municipal governments U.S. states... -
Page 173
... 31, 2012 (Canadian $ in millions) Balance, October 31, 2011 Included in earnings Purchases Sales Transfers into Maturities (1) Level 3 Transfers out of Level 3 Unrealized gains (losses) (2) Trading Securities Issued or guaranteed by: Canadian provincial and municipal governments U.S. states... -
Page 174
..., see the Liquidity and Funding Risk section on page 92 to 94 of our 2013 Annual Report. 2013 Total On-Balance Sheet Financial Instruments Assets Cash and cash equivalents Interest bearing deposits with banks Securities Trading securities Available-for-sale securities Held-to-maturity securities... -
Page 175
...2 years 2 to 5 years Over 5 years No maturity 2013 Total Liabilities and Equity Deposits (1) Banks Businesses and governments Individuals Total deposits Other Liabilities Derivative instruments Interest rate contracts Foreign exchange contracts Commodity contracts Equity contracts Credit contracts... -
Page 176
... other personal Credit cards Businesses and governments Customers' liability under acceptances Allowance for credit losses Total loans and acceptances, net of allowance Other Assets Derivative instruments Interest rate contracts Foreign exchange contracts Commodity contracts Equity contracts Credit... -
Page 177
...2 years 2 to 5 years Over 5 years No maturity 2012 Total Liabilities and Equity Deposits (1) Banks Businesses and governments Individuals Total deposits Other Liabilities Derivative instruments Interest rate contracts Foreign exchange contracts Commodity contracts Equity contracts Credit contracts... -
Page 178
... National Association BMO Harris Financial Advisors, Inc. BMO Harris Financing, Inc. and subsidiaries BMO Investment Financing, Inc. BMO Investment Partners Management, LLC and subsidiaries BMO Private Equity (U.S.), Inc. and subsidiaries Harris Life Insurance Company Harris Trade Services Limited... -
Page 179
...is typically less than 180 days. The commercial paper is backed by physical assets such as trade receivables, and is generally used for short-term financing needs. Assets-to-Capital Multiple reflects total assets, including specified off-balance sheet items net of other specified deductions, divided... -
Page 180
... exchange rate, credit spreads, equity and commodity prices and their implied volatilities. This measure calculates the maximum loss likely to be experienced in the portfolios, measured at a 99% confidence level over a specified holding period. Page 87 BMO Financial Group 196th Annual Report 2013... -
Page 181
... companies under New York Stock Exchange Listing Standards is posted on our website. www.bmo.com/corporategovernance Customers Online filing information: BMO filings in Canada Canadian Securities Administrators www.sedar.com For assistance with your investment portfolio or other financial... -
Page 182
... Trust Company of Canada or Shareholder Services for details. Direct Deposit You can choose to have your dividends deposited directly to an account in any financial institution in Canada or the United States that provides electronic funds transfer. Personal Information Security... -
Page 183
... Project was commissioned for this year's BMO Harris Bank Magnificent Mile Lights Festival as a way to celebrate the Chicago community. Focused on youth and families, the colourful mosaic mural was a city-wide, collaborative effort from more than 25 organizations and 400 BMO Harris employees...