American Home Shield 2015 Annual Report Download - page 2
Download and view the complete annual report
Please find page 2 of the 2015 American Home Shield annual report below. You can navigate through the pages in the report by either clicking on the pages listed below, or by using the keyword search tool below to find specific information within the annual report.-
 1
1 -
 2
2 -
 3
3 -
 4
4 -
 5
5 -
 6
6 -
 7
7 -
 8
8 -
 9
9 -
 10
10 -
 11
11 -
 12
12 -
 13
13 -
14
-
15
-
16
-
17
-
18
-
19
-
20
-
21
-
22
-
23
-
24
-
25
-
26
-
27
-
28
-
29
-
30
-
31
-
32
-
33
-
34
-
35
-
36
-
37
-
38
-
39
-
40
-
41
-
42
-
43
-
44
-
45
-
46
-
47
-
48
-
49
-
50
-
51
-
52
-
53
-
54
-
55
-
56
-
57
-
58
-
59
-
60
-
61
-
62
-
63
-
64
-
65
-
66
-
67
-
68
-
69
-
70
-
71
-
72
-
73
-
74
-
75
-
76
-
77
-
78
-
79
-
80
-
81
-
82
-
83
-
84
-
85
-
86
-
87
-
88
-
89
-
90
-
91
-
92
-
93
-
94
-
95
-
96
-
97
-
98
-
99
-
100
-
101
-
102
-
103
-
104
-
105
-
106
-
107
-
108
-
109
-
110
-
111
-
112
-
113
-
114
-
115
-
116
-
117
-
118
-
119
-
120
-
121
-
122
-
123
-
124
-
125
-
126
-
127
-
128
-
129
-
130
-
131
-
132
 |
 |

1 Adjusted EBITDA means net income (loss) before: income (loss) from
discontinued operations, net of income taxes; provision (benet) for income
taxes; loss on extinguishment of debt; interest expense; depreciation
and amortization expense; 401(k) Plan corrective contribution; non-cash
impairment of software and other related costs; non-cash impairment of
property and equipment; non-cash stock based compensation expense;
restructuring charges; gain on sale of Merry Maids branches; management
and consulting fees; consulting agreement termination fees; and other non-
operating expenses. For a reconciliation of Adjusted EBITDA to net income
(loss), see “Item 6. Selected Financial Data” in our Annual Report on Form
10-K included in this annual report to stockholders.
2 Adjusted EBITDA margin means Adjusted EBITDA as a percentage of revenue.
3 Adjusted Net Income means income from continuing operations before:
amortization expense; 401(k) Plan corrective contribution; impairment of
software and other related costs; consulting agreement termination fees;
restructuring charges; gain on sale of Merry Maids branches; management
and consulting fees; loss on extinguishment of debt; other expense; and
the tax impact of all the aforementioned adjustments. For a reconciliation
of Adjusted Net Income to income from continuing operations, see page 16.
4 Based on Adjusted Net Income and weighted average diluted shares
outstanding of 136.6 million in 2015 and 113.8 million in 2014.
5 Free Cash Flow means (i) net cash provided from operating activities from
continuing operations before: call premium paid on retirement of debt;
premium received on issuance of debt; cash paid for consulting agreement
termination fees; and excess tax benets from stock-based compensation;
(ii) less property additions. For a reconciliation of net cash provided from
operating activities from continuing operations to Free Cash Flow, see “Item
6. Selected Financial Data” in our Annual Report on Form 10-K included in
this annual report to stockholders.
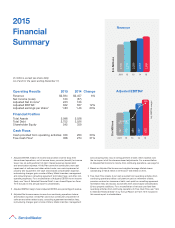
Operating Results 2015 2014 Change
Revenue $2,594 $2,457 6%
Net Income (Loss) 160 (57)
Adjusted Net Income3 245 166
Adjusted EBITDA1 622 557 12%
Adjusted earnings per share4 1.80 1.46 23%
Financial Position
Total Assets 5,098 5,028
Total Debt 2,752 3,026
Shareholder Equity 545 359
Cash Flows
Cash provided from operating activities 336 253 33%
Free Cash Flow5 358 274 31%
(In millions, except per-share data)
As of and for the years ending December 31,
2,594
2,105
151413122011
2,214
2,293
2,457
$ in Millions
Revenue
Adjusted EBITDA¹
557
622
397
413
450
19% 19%
20%
23%
24%
$ in Millions
Adj. EBITDA margin2
151413122011
2015
Financial
Summary