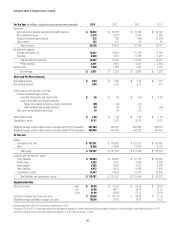
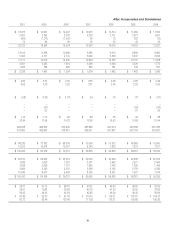
Aflac 2014 Annual Report Download - page 34
Download and view the complete annual report
Please find page 34 of the 2014 Aflac annual report below. You can navigate through the pages in the report by either clicking on the pages listed below, or by using the keyword search tool below to find specific information within the annual report.-
 1
1 -
2
-
3
-
4
-
5
-
6
-
7
-
8
-
9
-
10
-
11
-
12
-
13
-
14
-
15
-
16
-
17
-
18
-
19
-
20
-
21
-
22
-
23
-
 24
24 -
 25
25 -
 26
26 -
 27
27 -
 28
28 -
 29
29 -
 30
30 -
 31
31 -
 32
32 -
 33
33 -
 34
34 -
 35
35 -
 36
36 -
 37
37 -
 38
38 -
 39
39 -
 40
40
 |
 |
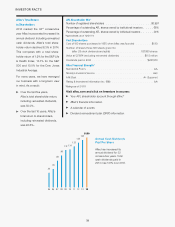
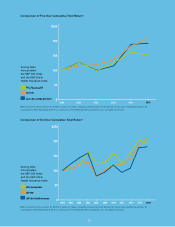
Aflac’s Total Return
to Shareholders
2014 marked the 32nd consecutive
year Aflac Incorporated increased its
annual dividend. Including reinvested
cash dividends, Aflac’s total share-
holder return declined 6.3% in 2014.
This compares with a total share-
holder return of 1.9% for the S&P Life
& Health Index, 13.7% for the S&P
500 and 10.0% for the Dow Jones
Industrial Average.
For many years, we have managed
our business with a long-term view
in mind. As a result:
Over the last five years,
Aflac’s total shareholder return,
including reinvested dividends,
was 50.0%.
Over the last 10 years, Aflac’s
total return to shareholders,
including reinvested dividends,
was 90.5%.
AFL Shareholder Mix*
Number of registered shareholders . . . . . . . . . . . . . . . . . . . . . . 86,997
Percentage of outstanding AFL shares owned by institutional investors . . . . . 66%
Percentage of outstanding AFL shares owned by individual investors . . . . . . 34%
*Approximate, as of 12/31/14
First Shareholders
Cost of 100 shares purchased in 1955 when Aflac was founded . . . . . . . . $1,110
Number of shares those 100 shares grew into
(after 28 stock dividends and splits) . . . . . . . . . . . . . . . . 187,980 shares
Value at 12/31/14 (excluding reinvested dividends) . . . . . . . . . . . . . $11.5 million
Dividends paid in 2014 . . . . . . . . . . . . . . . . . . . . . . . . . . . . . . $281,970
Aflac Financial Strength*
Standard & Poor’s . . . . . . . . . . . . . . . . . . . . . . . . . . . . . . . . . . . . . AA-
Moody’s Investors Service . . . . . . . . . . . . . . . . . . . . . . . . . . . . . . . Aa3
A.M. Best . . . . . . . . . . . . . . . . . . . . . . . . . . . . . . . . . . . . A+ (Superior)
Rating & Investment Information Inc. (R&I) . . . . . . . . . . . . . . . . . . . . . . . AA-
*Ratings as of 3/1/15
Visit aflac.com and click on Investors to access:
Your AFL shareholder account through aflinc®
Aflac’s financial information
A calendar of events
Dividend reinvestment plan (DRIP) information
INVESTOR FACTS
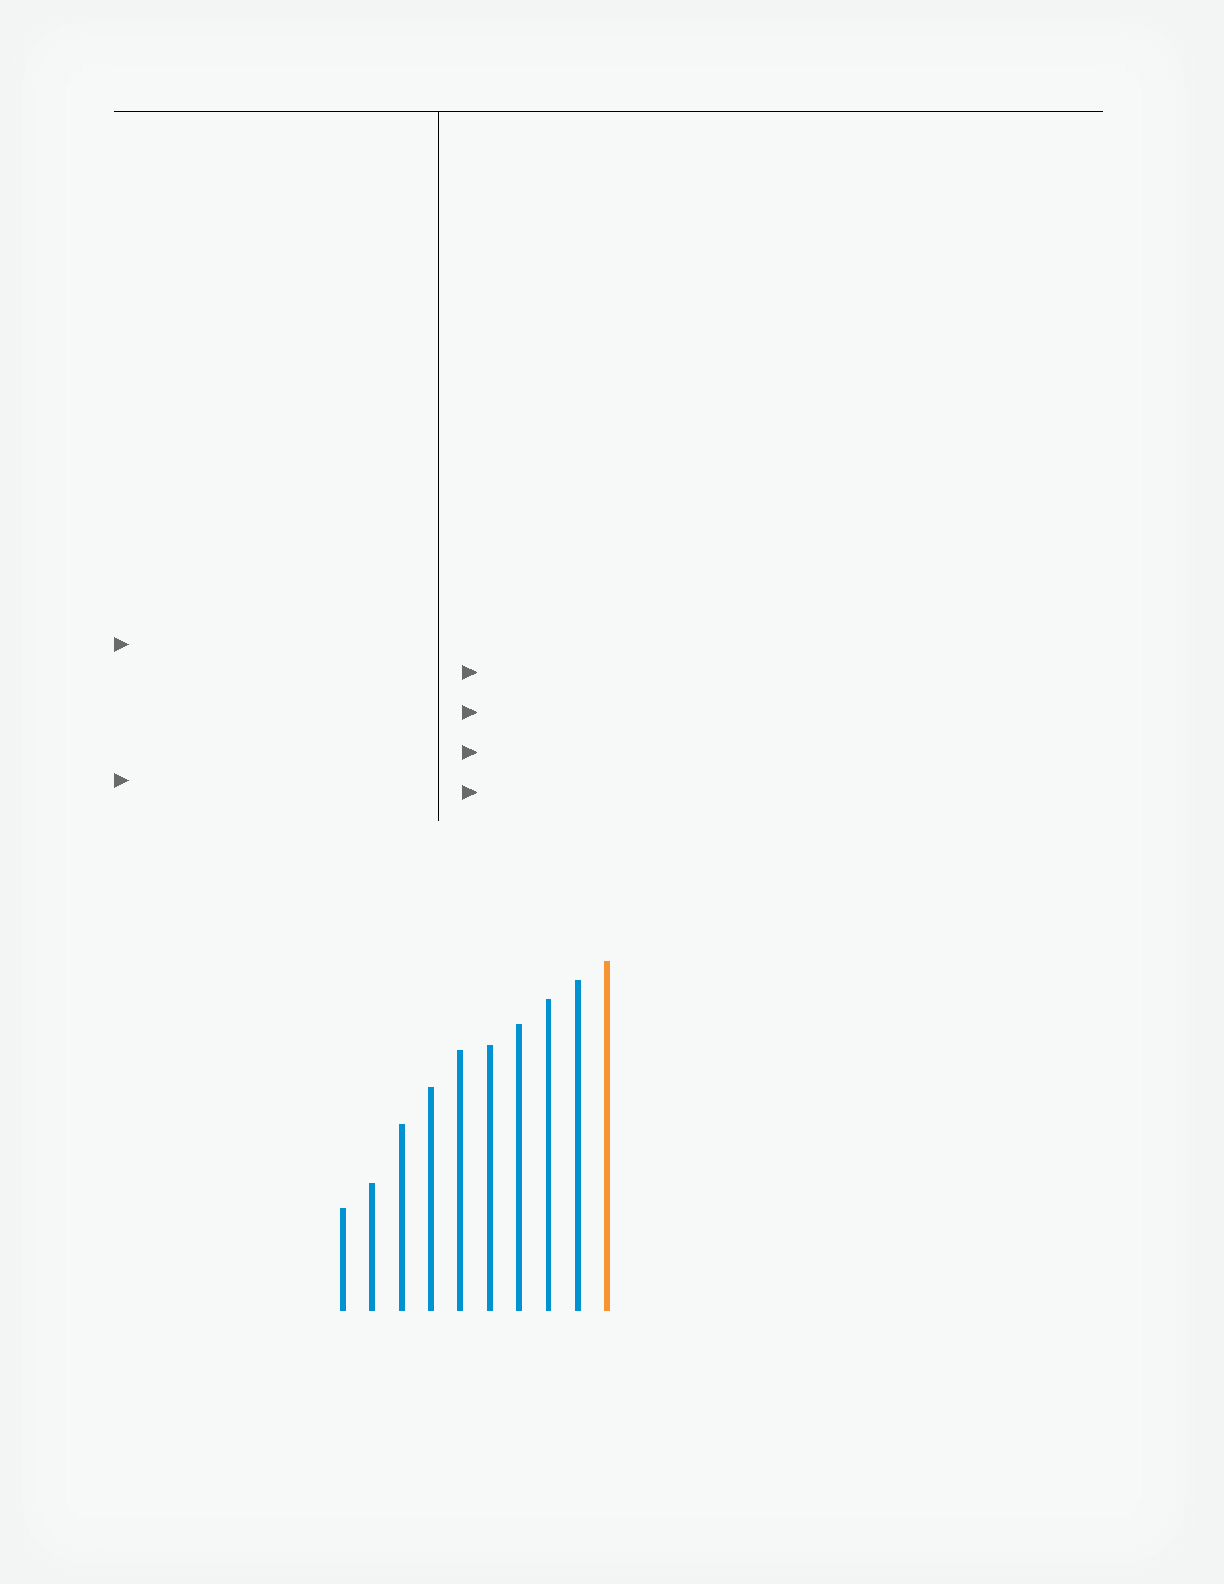
Annual Cash Dividends
Paid Per Share
Aflac has increased its
annual dividend for 32
consecutive years. Total
cash dividends paid in
2014 rose 5.6% over 2013.
05 06 07 08 09 10 11 12 13 14
.44
.80
.96
1.12 1.14
1.23
1.34
1.42
$1.50
.55
32