Aflac 2014 Annual Report Download - page 32
Download and view the complete annual report
Please find page 32 of the 2014 Aflac annual report below. You can navigate through the pages in the report by either clicking on the pages listed below, or by using the keyword search tool below to find specific information within the annual report.-
 1
1 -
2
-
3
-
4
-
5
-
6
-
7
-
8
-
9
-
10
-
11
-
12
-
13
-
14
-
15
-
16
-
17
-
18
-
19
-
20
-
21
-
 22
22 -
 23
23 -
 24
24 -
 25
25 -
 26
26 -
 27
27 -
 28
28 -
 29
29 -
 30
30 -
 31
31 -
 32
32 -
 33
33 -
 34
34 -
 35
35 -
 36
36 -
 37
37 -
 38
38 -
 39
39 -
 40
40
 |
 |

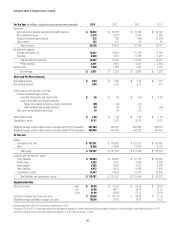
For the Year (In millions, except for share and per-share amounts) 2014 2013 2012 2011
Revenues:
Net premiums, principally supplemental health insurance $ 19,072 $ 20,135 $ 22,148 $ 20,362
Net investment income 3,319 3,293 3,473 3,280
Realized investment gains (losses) 215 399 (349) (1,552)
Other income 122 112 92 81
Total revenues 22,728 23,939 25,364 22,171
Benefits and expenses:
Benefits and claims, net 12,937 13,813 15,330 13,749
Expenses 5,300 5,310 5,732 5,472
Total benefits and expenses 18,237 19,123 21,062 19,221
Pretax earnings 4,491 4,816 4,302 2,950
Income taxes 1,540 1,658 1,436 1,013
Net earnings $ 2,951 $ 3,158 $ 2,866 $ 1,937
Share and Per-Share Amounts
Net earnings (basic) $ 6.54 $ 6.80 $ 6.14 $ 4.15
Net earnings (diluted) 6.50 6.76 6.11 4.12
Items impacting net earnings, net of tax:
Realized investment gains (losses):
Securities transactions and impairments $ .26 $ .09 $ (.69) $ (1.81)
Impact of derivative and hedging activities:
Hedge costs related to foreign currency investments (.05) (.04) (.01) –
Other derivative and hedging activities* .03 .49 .22 (.34)
Other and non-operating income (loss) .10 .04 (.01) –
Cash dividends paid $ 1.50 $ 1.42 $ 1.34 $ 1.23
Shareholders’ equity 41.47 31.82 34.16 27.76
Weighted-average common shares used to calculate basic EPS (In thousands) 451,204 464,502 466,868 466,519
Weighted-average common shares used to calculate diluted EPS (In thousands) 454,000 467,408 469,287 469,370
At Year-end
Assets:
Investments and cash $ 107,341 $ 108,459 $ 118,219 $ 103,462
Other 12,426 12,848 12,875 12,775
Total assets $ 119,767 $ 121,307 $ 131,094 $ 116,237
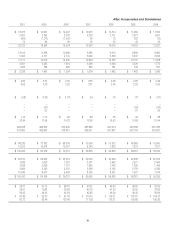
Liabilities and shareholders’ equity:
Policy liabilities $ 83,933 $ 89,402 $ 97,720 $ 94,239
Income taxes 5,293 3,718 3,858 2,308
Notes payable 5,282 4,897 4,352 3,285
Other liabilities 6,912 8,670 9,186 3,459
Shareholders’ equity 18,347 14,620 15,978 12,946
Total liabilities and shareholders’ equity $ 119,767 $ 121,307 $ 131,094 $ 116,237
Supplemental Data
Stock price range: High $ 66.69 $ 67.62 $ 54.93 $ 59.54
Low 54.99 48.17 38.14 31.25
Close 61.09 66.80 53.12 43.26
Yen/dollar exchange rate at year-end (yen) ¥ 120.55 ¥ 105.39 ¥ 86.58 ¥ 77.74
Weighted-average yen/dollar exchange rate (yen) 105.46 97.54 79.81 79.75
*Includes impact from ASC 815 for all years presented prior to 2011
Amounts in 2010 and 2011 have been adjusted for retrospective adoption of revised accounting guidance related to deferral of policy acquisition costs effective January 1, 2012.
Amounts in 2003 and 2004 have been adjusted for adoption of SFAS 123R on January 1, 2005.
SELECTED FINANCIAL DATA
30