Aflac 2014 Annual Report Download - page 26
Download and view the complete annual report
Please find page 26 of the 2014 Aflac annual report below. You can navigate through the pages in the report by either clicking on the pages listed below, or by using the keyword search tool below to find specific information within the annual report.-
 1
1 -
2
-
3
-
4
-
5
-
6
-
7
-
8
-
9
-
10
-
11
-
12
-
13
-
14
-
15
-
 16
16 -
 17
17 -
 18
18 -
 19
19 -
 20
20 -
 21
21 -
 22
22 -
 23
23 -
 24
24 -
 25
25 -
 26
26 -
 27
27 -
 28
28 -
 29
29 -
 30
30 -
 31
31 -
 32
32 -
 33
33 -
 34
34 -
 35
35 -
 36
36 -
37
-
38
-
39
-
40
 |
 |

24
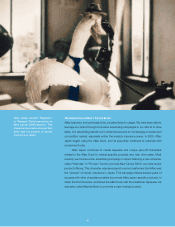
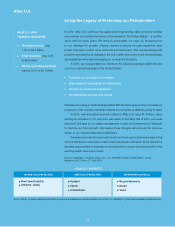
In 2014, Aflac U.S. continued its legacy and longstanding vision to be the number
one provider of voluntary insurance at the worksite in the United States* – a position
we’ve held for many years. We strive to accomplish our vision by remaining true
to our strategy for growth: offering relevant products through expanded distri-
bution channels to reach more accounts and customers. This requires being both
proactive and reactive to changes in the U.S. health care environment and workplace
demographics while also leveraging our company’s strengths.
In 2014, we concentrated our efforts on the following strategic pillars that are
core to our growth strategy in the United States:
• Focusing on our product innovation
• Improving and expanding our distribution
• Owning our customer experience
• Strengthening our low-cost model
We believe focusing on these strategic pillars affords us the opportunity to increase our
presence in the voluntary worksite markets and enhance profitability going forward.
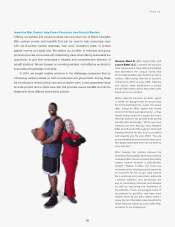
In 2014, new annualized premium sales for Aflac U.S. were $1.4 billion, repre-
senting an increase of .7% over prior year sales. In the latter half of 2014, we made
structural changes to our sales management model and infrastructure designed
to improve our future growth. We believe these changes will enhance the value we
deliver to our shareholders and bondholders.
We believe the need for our products will continue to grow, and we are supporting
various distribution channels to reach more businesses of all sizes. At the same time,
we seek opportunities to leverage our strong brand to support product growth in the
evolving health care environment.
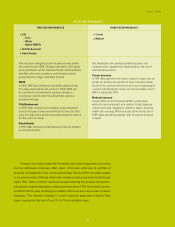
AFLAC U.S. PRODUCTS
INCOMELOSS PROTECTION ASSETLOSS PROTECTION SUPPLEMENTAL MEDICAL
Short-Term Disability
Life (term, whole)
Accident
Cancer
Critical Illness
Hospital Indemnity
Dental
Vision
Note: Cancer, Hospital Indemnity and Vision products are available as individual policies only in the U.S.; Benefits of group and individual policies may vary.
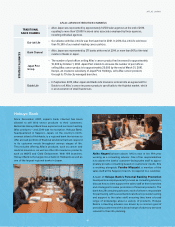
AFLAC U.S. 2014
FINANCIAL HIGHLIGHTS:
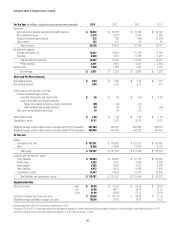
Premium income rose
1.1% to $5.2 billion.
Total revenues rose 1.2%
to $5.9 billion.
Pretax operating earnings
rose by 3.3% to $1.1 billion.
*Source: Eastbridge Consulting Group, Inc. U.S. Worksite/Voluntary Sales Report. Carrier
Results for 2013. Avon, CT: April 2014
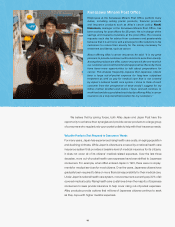
Aflac U.S.
Living the Legacy of Protecting our Policyholders