Access America 2008 Annual Report Download - page 33
Download and view the complete annual report
Please find page 33 of the 2008 Access America annual report below. You can navigate through the pages in the report by either clicking on the pages listed below, or by using the keyword search tool below to find specific information within the annual report.-
 1
1 -
2
-
3
-
4
-
5
-
6
-
7
-
8
-
9
-
10
-
11
-
12
-
13
-
14
-
15
-
16
-
17
-
18
-
19
-
20
-
21
-
22
-
 23
23 -
 24
24 -
 25
25 -
 26
26 -
 27
27 -
 28
28 -
 29
29 -
 30
30 -
 31
31 -
 32
32 -
 33
33 -
 34
34 -
 35
35 -
 36
36 -
 37
37 -
 38
38 -
 39
39 -
 40
40 -
 41
41 -
 42
42 -
 43
43 -
44
-
45
-
46
-
47
-
48
-
49
-
50
-
51
-
52
-
53
-
54
 |
 |

Mondial Assistance Annual Report 2008 29
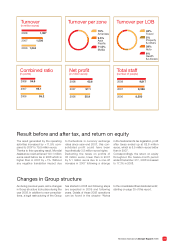
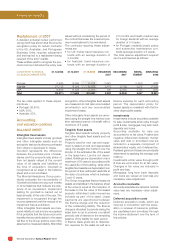
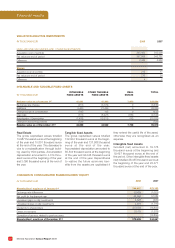
The result generated by the operating
activities increased by +11.9% com-
pared to 2007 to 79.9 million euros.
Thanks to this operating result, Mondial
Assistance could achieved 103.1 million
euros result before tax in 2008 which is
higher than in 2007 by +1%. Without
any negative translation impact due
to fluctuations in currency exchange
rates since year-end 2007, this con-
solidated profit could have been
hypothetically 3.5 million euros higher.
Deducting the taxes on profits of
38 million euros, lower than in 2007
by 5.1 million euros due to a one-off
increase in 2007 following a change
in the Switzerland’s tax legislation, profi t
after taxes ended up at 62.6 million
euros, which is 5.5 million euros better
than in 2007.
Correspondingly, the return on equity
throughout the twelve-month period
ended December 31st, 2008 increased
to 17.3% in 2008.
Result before and after tax, and return on equity
As during previous years, some changes
in Group structure took place during the
year 2008. In addition to new consolida-
tions, a legal restructuring of the Group
has started in 2008 and following steps
are expected in 2009 and following
years. Details of these 2008 operations
can be found in the chapter “Notes
to the consolidated fi nancial statements”,
starting on page 35 of this report.
Changes in Group structure
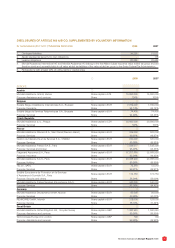
Turnover
(in million euros)
2008
1,597
2007 1,508
2006 1,344
Total staff
(number of people)
2008 9,817
2007 9,356
2006 8,550
Net profi t
(in million euros)
2008 62.6
2007 57.1
2006 55.9
Combined ratio
(in points)
2008 94.9
2007 95.1
2006 95.2
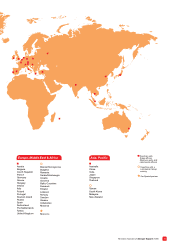
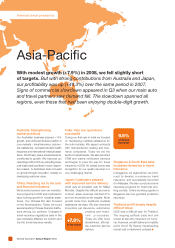
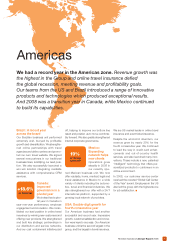
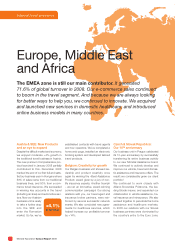
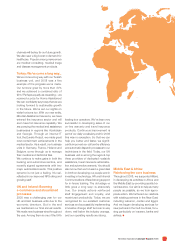
Turnover per zone
19%
9.5%
Asia
Pacific
71.5%
EMEA
Americas
Turnover per LOB
48%
8%
Health
& Lifecare
39%
Auto
Travel
5%
Property
& others