iHeartMedia 2009 Annual Report Download - page 9
Download and view the complete annual report
Please find page 9 of the 2009 iHeartMedia annual report below. You can navigate through the pages in the report by either clicking on the pages listed below, or by using the keyword search tool below to find specific information within the annual report.-
 1
1 -
 2
2 -
 3
3 -
 4
4 -
 5
5 -
 6
6 -
 7
7 -
 8
8 -
 9
9 -
 10
10 -
 11
11 -
 12
12 -
 13
13 -
 14
14 -
 15
15 -
 16
16 -
 17
17 -
 18
18 -
 19
19 -
 20
20 -
21
-
22
-
23
-
24
-
25
-
26
-
27
-
28
-
29
-
30
-
31
-
32
-
33
-
34
-
35
-
36
-
37
-
38
-
39
-
40
-
41
-
42
-
43
-
44
-
45
-
46
-
47
-
48
-
49
-
50
-
51
-
52
-
53
-
54
-
55
-
56
-
57
-
58
-
59
-
60
-
61
-
62
-
63
-
64
-
65
-
66
-
67
-
68
-
69
-
70
-
71
-
72
-
73
-
74
-
75
-
76
-
77
-
78
-
79
-
80
-
81
-
82
-
83
-
84
-
85
-
86
-
87
-
88
-
89
-
90
-
91
-
92
-
93
-
94
-
95
-
96
-
97
-
98
-
99
-
100
-
101
-
102
-
103
-
104
-
105
-
106
-
107
-
108
-
109
-
110
-
111
-
112
-
113
-
114
-
115
-
116
-
117
-
118
-
119
-
120
-
121
-
122
-
123
-
124
-
125
-
126
-
127
-
128
-
129
-
130
-
131
-
132
-
133
-
134
-
135
-
136
-
137
-
138
-
139
-
140
-
141
-
142
-
143
-
144
-
145
-
146
-
147
-
148
-
149
-
150
-
151
-
152
-
153
-
154
-
155
-
156
-
157
-
158
-
159
-
160
-
161
-
162
-
163
-
164
-
165
-
166
-
167
-
168
-
169
-
170
-
171
-
172
-
173
-
174
-
175
-
176
-
177
-
178
-
179
-
180
-
181
-
182
-
183
-
184
-
185
-
186
-
187
-
188
 |
 |

No assurance can be given that the restructuring program will achieve all of the anticipated cost savings in the timeframe
expected or at all, or that the cost savings will be sustainable. In addition, we may modify or terminate the restructuring program in
response to economic conditions or otherwise.
We plan to continue controlling costs to achieve operating efficiencies, sharing best practices across our markets and
focusing our capital expenditures on opportunities that we expect to yield higher returns, leveraging our flexibility to make capital
outlays based on the environment.
Continue to Deploy Digital Billboards. Digital outdoor advertising provides significant advantages over traditional outdoor
media. Our electronic displays may be linked through centralized computer systems to instantaneously and simultaneously change
advertising copy on a large number of displays. The ability to change copy by time-of-day and quickly change messaging based on
advertisers’ needs creates additional flexibility for our customers. The advantages of digital allow us to penetrate new accounts and
categories of advertisers as well as serve a broader set of needs for existing advertisers. We expect this to continue as we increase our
quantity of digital inventory. We have deployed a total of approximately 457 digital displays in 33 markets as of December 31, 2009,
of which approximately 292 are in the top 20 U.S. markets.
Sources of Revenue
Americas Outdoor Advertising generated 22%, 21% and 21% of our revenue in 2009, 2008 and 2007, respectively.
Americas Outdoor Advertising revenue is derived from the sale of advertising copy placed on our display inventory. Our display
inventory consists primarily of billboards, street furniture displays and transit displays. The margins on our billboard contracts tend to
be higher than those on contracts for other displays, due to their greater size, impact and location along major roadways that are
highly trafficked. Billboards comprise approximately two-thirds of our display revenues. The following table shows the approximate
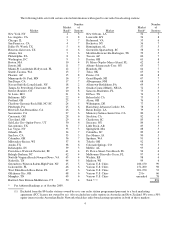
percentage of revenue derived from each category for our Americas Outdoor Advertising inventory:
(1) Includes digital displays.
(2) Includes spectaculars, mall displays and wallscapes.
Our Americas Outdoor Advertising segment generates revenues from local, regional and national sales. Our advertising
rates are based on a number of different factors including location, competition, size of display, illumination, market and gross ratings
points. Gross ratings points are the total number of impressions delivered, expressed as a percentage of a market population, of a
display or group of displays. The number of impressions delivered by a display is measured by the number of people passing the site
during a defined period of time. For all of our billboards in the United States, we use independent, third-party auditing companies to
verify the number of impressions delivered by a display. “Reach” is the percent of a target audience exposed to an advertising
message at least once during a specified period of time, typically during a period of four weeks. “Frequency” is the average number o
f
exposures an individual has to an advertising message during a specified period of time. Out-of-home frequency is typically measured
over a four-week period.
While location, price and availability of displays are important competitive factors, we believe that providing quality
customer service and establishing strong client relationships are also critical components of sales. In addition, we have long-standing
relationships with a diversified group of advertising brands and agencies that allow us to diversify client accounts and establish
continuing revenue streams.
6
Year Ended December 31,
2009
2008
2007
Billboards
Bulletins
52%
51%
52%
Posters
14%
15%
16%
Street furniture displays
5%
5%
4%
Transit displays
17%
17%
16%
Other displays
12%
12%
12%
Total
100%
100%
100%
(1)
(2)