iHeartMedia 2009 Annual Report Download - page 11
Download and view the complete annual report
Please find page 11 of the 2009 iHeartMedia annual report below. You can navigate through the pages in the report by either clicking on the pages listed below, or by using the keyword search tool below to find specific information within the annual report.-
 1
1 -
 2
2 -
 3
3 -
 4
4 -
 5
5 -
 6
6 -
 7
7 -
 8
8 -
 9
9 -
 10
10 -
 11
11 -
 12
12 -
 13
13 -
 14
14 -
 15
15 -
 16
16 -
 17
17 -
 18
18 -
 19
19 -
 20
20 -
 21
21 -
 22
22 -
23
-
24
-
25
-
26
-
27
-
28
-
29
-
30
-
31
-
32
-
33
-
34
-
35
-
36
-
37
-
38
-
39
-
40
-
41
-
42
-
43
-
44
-
45
-
46
-
47
-
48
-
49
-
50
-
51
-
52
-
53
-
54
-
55
-
56
-
57
-
58
-
59
-
60
-
61
-
62
-
63
-
64
-
65
-
66
-
67
-
68
-
69
-
70
-
71
-
72
-
73
-
74
-
75
-
76
-
77
-
78
-
79
-
80
-
81
-
82
-
83
-
84
-
85
-
86
-
87
-
88
-
89
-
90
-
91
-
92
-
93
-
94
-
95
-
96
-
97
-
98
-
99
-
100
-
101
-
102
-
103
-
104
-
105
-
106
-
107
-
108
-
109
-
110
-
111
-
112
-
113
-
114
-
115
-
116
-
117
-
118
-
119
-
120
-
121
-
122
-
123
-
124
-
125
-
126
-
127
-
128
-
129
-
130
-
131
-
132
-
133
-
134
-
135
-
136
-
137
-
138
-
139
-
140
-
141
-
142
-
143
-
144
-
145
-
146
-
147
-
148
-
149
-
150
-
151
-
152
-
153
-
154
-
155
-
156
-
157
-
158
-
159
-
160
-
161
-
162
-
163
-
164
-
165
-
166
-
167
-
168
-
169
-
170
-
171
-
172
-
173
-
174
-
175
-
176
-
177
-
178
-
179
-
180
-
181
-
182
-
183
-
184
-
185
-
186
-
187
-
188
 |
 |

Other Inventory
The balance of our display inventory consists of spectaculars, wallscapes and mall displays. Spectaculars are customized
display structures that often incorporate video, multidimensional lettering and figures, mechanical devices and moving parts and other
embellishments to create special effects. The majority of our spectaculars are located in Times Square in New York City, Dundas
Square in Toronto, Fashion Show in Las Vegas, Miracle Mile in Las Vegas, Westgate City Center in Glendale, Arizona, the
Boardwalk in Atlantic City and across from the Target Center in Minneapolis. Client contracts for spectaculars typically have terms
of one year or longer. A wallscape is a display that drapes over or is suspended from the sides of buildings or other structures.
Generally, wallscapes are located in high-profile areas where other types of outdoor advertising displays are limited or unavailable.
Clients typically contract for individual wallscapes for extended terms. We also own displays located within the common areas of
malls on which our clients run advertising campaigns for periods ranging from four weeks to one year.
Competition
The outdoor advertising industry in the Americas is fragmented, consisting of several larger companies involved in outdoor
advertising, such as CBS and Lamar Advertising Company, as well as numerous smaller and local companies operating a limited
number of display faces in a single or a few local markets. We also compete with other advertising media in our respective markets,
including broadcast and cable television, radio, print media, direct mail, the Internet and other forms of advertisement.
Outdoor companies compete primarily based on ability to reach consumers, which is driven by location of the display.
A
dvertising Inventory and Markets
As of December 31, 2009, we owned or operated approximately 195,000 displays in our Americas Outdoor Advertising
segment. Our displays are located on owned land, leased land or land for which we have acquired permanent easements. The majority
of the advertising structures on which our displays are mounted require permits. Our permits are effectively issued in perpetuity by
state and local governments and are typically transferable or renewable at little or no cost. Permits typically specify the location
which allows us the right to operate an advertising structure at the specified location.
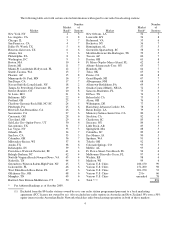
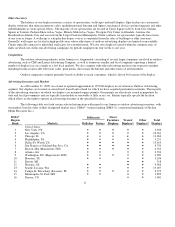
The following table sets forth certain selected information with regard to our Americas outdoor advertising inventory, with
our markets listed in order of their designated market area (“DMA ”) region ranking (DMA is a registered trademark of Nielsen
Media Research, Inc.):
8
DMA
Region
Rank
Markets
Billboards
Street
Furniture
Dis
p
la
y
s
Transit
Dis
p
la
y
s
Other
Dis
p
la
y
s
Total
Dis
p
la
y
s
Bulletins Posters
United States
1
New York, NY
2,636
2
Los Angeles, CA
10,361
3
Chicago, IL
11,264
4
Philadelphia, PA
5,251
5
Dallas-Ft. Worth, TX
15,414
6
San Francisco-Oakland-San Jose, CA
9,331
7
Boston, MA (Manchester, NH)
2,762
8
Atlanta, GA
2,354
9
Washington, DC (Hagerstown, MD)
2,907
10
Houston, TX
3,104
11
Detroit, MI
318
12
Phoenix, AZ
9,566
13
Seattle-Tacoma, WA
13,057
14
Tamp
a
-St. Petersburg (Sarasota), FL
2,273
15
Minneapolis-St. Paul, MN
1,899
16
Denver, CO
1,001
®®
®
(1) (2)