iHeartMedia 2009 Annual Report Download - page 12
Download and view the complete annual report
Please find page 12 of the 2009 iHeartMedia annual report below. You can navigate through the pages in the report by either clicking on the pages listed below, or by using the keyword search tool below to find specific information within the annual report.-
 1
1 -
 2
2 -
 3
3 -
 4
4 -
 5
5 -
 6
6 -
 7
7 -
 8
8 -
 9
9 -
 10
10 -
 11
11 -
 12
12 -
 13
13 -
 14
14 -
 15
15 -
 16
16 -
 17
17 -
 18
18 -
 19
19 -
 20
20 -
 21
21 -
 22
22 -
23
-
24
-
25
-
26
-
27
-
28
-
29
-
30
-
31
-
32
-
33
-
34
-
35
-
36
-
37
-
38
-
39
-
40
-
41
-
42
-
43
-
44
-
45
-
46
-
47
-
48
-
49
-
50
-
51
-
52
-
53
-
54
-
55
-
56
-
57
-
58
-
59
-
60
-
61
-
62
-
63
-
64
-
65
-
66
-
67
-
68
-
69
-
70
-
71
-
72
-
73
-
74
-
75
-
76
-
77
-
78
-
79
-
80
-
81
-
82
-
83
-
84
-
85
-
86
-
87
-
88
-
89
-
90
-
91
-
92
-
93
-
94
-
95
-
96
-
97
-
98
-
99
-
100
-
101
-
102
-
103
-
104
-
105
-
106
-
107
-
108
-
109
-
110
-
111
-
112
-
113
-
114
-
115
-
116
-
117
-
118
-
119
-
120
-
121
-
122
-
123
-
124
-
125
-
126
-
127
-
128
-
129
-
130
-
131
-
132
-
133
-
134
-
135
-
136
-
137
-
138
-
139
-
140
-
141
-
142
-
143
-
144
-
145
-
146
-
147
-
148
-
149
-
150
-
151
-
152
-
153
-
154
-
155
-
156
-
157
-
158
-
159
-
160
-
161
-
162
-
163
-
164
-
165
-
166
-
167
-
168
-
169
-
170
-
171
-
172
-
173
-
174
-
175
-
176
-
177
-
178
-
179
-
180
-
181
-
182
-
183
-
184
-
185
-
186
-
187
-
188
 |
 |

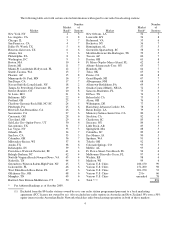
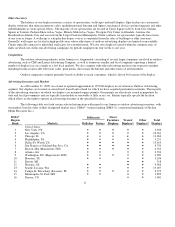
9
DMA
Region
Rank
Markets
Billboards
Street
Furniture
Dis
p
la
y
s
Transit
Dis
p
la
y
s
Other
Dis
p
la
y
s
Total
Dis
p
la
y
s
Bulletins
Posters
17
Miami-Ft. Lauderdale, FL
5,267
18
Clevelan
d
-Akron (Canton), OH
3,479
19
Orlando-Daytona Beach-Melbourne, FL
3,798
20
Sacramento-Stockton-Modesto, CA
2,623
21
St. Louis, MO
297
22
Portland, O
R
1,191
23
Pittsburgh, PA
94
24
Charlotte, NC
12
25
Indianapolis, IN
3,193
26
Raleigh-Durham (Fayetteville), NC
1,803
27
Baltimore, MD
1,910
28
San Diego, CA
765
29
Nashville, TN
756
30
Hartford-New Haven, CT
656
31
Salt Lake City, UT
66
32
Kansas City, KS/MO
1,173
33
Cincinnati, OH
12
34
Columbus, OH
1,635
35
Milwaukee, WI
6,473
36
Greenville-Spartanburg, SC- Asheville, NC-
Anderson, SC
91
37
San Antonio, TX
7,227
38
West Palm Beach-Ft. Pierce, FL
1,465
39
Harrisburg-Lancaster-Lebanon-York, PA
174
41
Grand Rapids-Kalamazoo-Battle Creek, MI
312
42
Las Vegas, NV
1,121
43
Norfol
k
-Portsmouth-Newport News, VA
390
44
Albuquerque-Santa Fe, NM
1,298
45
Oklahoma City, OK
3
46
Greensboro-High Poin
t
-Winston Salem, NC
1,047
47
Jacksonville, FL
978
48
Austin, TX
46
49
Louisville, KY
159
50
Memphis, TN
1,747
51-100
Various U.S. Cities
15,349
101-150
Various U.S. Cities
4,119
151+
Various U.S. Cities
2,224
N
on-U.S. Markets
n/a
Australia
1,466
n/
a
Brazil
7,199
n/
a
Canad
a
4,706
n/
a
Chile
1,085
n/
a
Mexico
4,998
n/
a
New Zealand
1,695
n/
a
Peru
2,659
n/a
Other
4,316
Total Americas Dis
p
la
y
s
194,575
(1) Included in transit displays is our airport advertising business which offers products such as traditional static wall displays,
visitor information centers, and other digital products including LCD screens and touch screen kiosks. Our digital products
provide multiple display opportunities unlike our traditional static wall displays. Each of the digital display opportunities is
counted as a unique display in the table.
®
(1) (2)
(3)