eTrade 2000 Annual Report Download - page 14
Download and view the complete annual report
Please find page 14 of the 2000 eTrade annual report below. You can navigate through the pages in the report by either clicking on the pages listed below, or by using the keyword search tool below to find specific information within the annual report.-
 1
1 -
2
-
3
-
 4
4 -
 5
5 -
 6
6 -
 7
7 -
 8
8 -
 9
9 -
 10
10 -
 11
11 -
 12
12 -
 13
13 -
 14
14 -
 15
15 -
 16
16 -
 17
17 -
 18
18 -
 19
19 -
 20
20 -
 21
21 -
 22
22 -
 23
23 -
 24
24 -
25
-
26
-
27
-
28
-
29
-
30
-
31
-
32
-
33
-
34
-
35
-
36
-
37
-
38
-
39
-
40
-
41
-
42
-
43
-
44
-
45
-
46
-
47
-
48
-
49
-
50
-
51
-
52
-
53
-
54
-
55
-
56
-
57
-
58
-
59
-
60
-
61
-
62
-
63
-
64
-
65
-
66
-
67
-
68
-
69
-
70
-
71
-
72
-
73
-
74
-
75
-
76
-
77
-
78
-
79
-
80
-
81
-
82
-
83
-
84
-
85
-
86
-
87
-
88
-
89
-
90
-
91
-
92
-
93
-
94
-
95
-
96
-
97
-
98
-
99
-
100
-
101
-
102
-
103
-
104
-
105
-
106
-
107
-
108
-
109
-
110
-
111
-
112
-
113
-
114
-
115
-
116
-
117
-
118
-
119
-
120
-
121
-
122
-
123
-
124
-
125
-
126
-
127
-
128
-
129
-
130
-
131
-
132
-
133
-
134
-
135
-
136
-
137
-
138
-
139
-
140
-
141
-
142
-
143
-
144
-
145
-
146
-
147
-
148
-
149
-
150
-
151
-
152
-
153
-
154
-
155
-
156
-
157
-
158
-
159
-
160
-
161
-
162
-
163
-
164
-
165
-
166
-
167
-
168
-
169
-
170
-
171
-
172
-
173
-
174
-
175
-
176
-
177
-
178
-
179
-
180
-
181
-
182
-
183
-
184
-
185
-
186
-
187
-
188
-
189
-
190
-
191
-
192
-
193
-
194
-
195
-
196
-
197
-
198
-
199
-
200
-
201
-
202
-
203
-
204
-
205
-
206
-
207
-
208
-
209
-
210
-
211
-
212
-
213
-
214
-
215
-
216
-
217
-
218
-
219
-
220
-
221
-
222
-
223
-
224
-
225
-
226
-
227
-
228
-
229
-
230
-
231
-
232
-
233
-
234
-
235
-
236
-
237
-
238
-
239
-
240
-
241
-
242
-
243
-
244
-
245
-
246
-
247
-
248
-
249
-
250
-
251
-
252
-
253
-
254
-
255
-
256
-
257
-
258
-
259
-
260
-
261
-
262
-
263
 |
 |

Commercial 657 664 372 568 1,217
Land — — 316 — —
Home equity lines of credit and
second mortgage loans
— 21 255 — 54
Other — 60 205 — —
Total 12,048 8,340 8,875 10,927 10,250
TDRs — — — 425 435
Total of non-accrual loans and
TDRs
12,048 8,340 8,875 11,352 10,685
REO: One- to four-family 850 539 1,460 681 1,300
Valuation allowance for REO — — — — (65 )
Total REO, net 850 539 1,460 681 1,235
Total non-performing assets, net $ 12,898 $ 8,879 $ 10,335 $ 12,033 $ 11,920
Total non-performing assets, net,
as a percentage of total bank
assets
0.14 %
0.21 %
0.45 %
1.09 %
1.84 %
Total loss allowance as a
percentage of total non-
performing loans, net
90.72 %
85.86 %
53.70 %
31.66 %
27.67 %
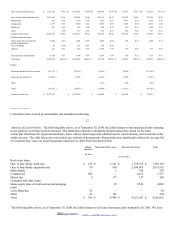
During fiscal 2000, our non-performing assets increased by $4.0 million, or 45.3%, to $12.9 million at September 30, 2000 from $8.9
million at September 30, 1999. As a matter of policy, we actively monitor our non-performing assets.
During fiscal 2000 and 1999, if our non-accruing loans had been performing in accordance with their terms, we would have recorded
interest income of approximately $845,000 and $550,000, respectively. However, none of the interest income disclosed was
recognized as income during the periods.
Special Mention Loans . In certain situations, a borrower’ s past credit history may lead to doubt regarding the borrower’ s ability to
repay under the loan’ s contractual terms, whether or not the loan is delinquent. Such loans, classified as “special mention” loans,
continue to accrue interest and remain as a component of the loans receivable balance. These loans represented $148,000 of the total
loan portfolio at September 30, 2000, and are actively monitored.
15
Allowance for Loan Losses. As an investor in mortgage loans, we recognize that we will experience occasional credit losses. We
believe the risk of credit loss varies with, among other things, the following:
type of loan;
creditworthiness of the borrower over the term of the loan;
general economic conditions; and
in the case of a secured loan, the quality of the security for the loan.
Our policy is to maintain an adequate allowance for loan losses based on, among other things, the following:
our historical loan loss experience;
regular reviews of delinquencies and loan portfolio quality;
the industry’ s historical loan loss experience for similar asset types; and
evaluation of economic conditions.
We increase our allowance for loan losses when we estimate that losses have been incurred by charging provisions for probable loan
losses against income. Charge-offs reduce the allowance when losses are confirmed.
2002. EDGAR Online, Inc.