eTrade 2000 Annual Report Download - page 10
Download and view the complete annual report
Please find page 10 of the 2000 eTrade annual report below. You can navigate through the pages in the report by either clicking on the pages listed below, or by using the keyword search tool below to find specific information within the annual report.-
 1
1 -
 2
2 -
 3
3 -
 4
4 -
 5
5 -
 6
6 -
 7
7 -
 8
8 -
 9
9 -
 10
10 -
 11
11 -
 12
12 -
 13
13 -
 14
14 -
 15
15 -
 16
16 -
 17
17 -
 18
18 -
 19
19 -
 20
20 -
 21
21 -
22
-
23
-
24
-
25
-
26
-
27
-
28
-
29
-
30
-
31
-
32
-
33
-
34
-
35
-
36
-
37
-
38
-
39
-
40
-
41
-
42
-
43
-
44
-
45
-
46
-
47
-
48
-
49
-
50
-
51
-
52
-
53
-
54
-
55
-
56
-
57
-
58
-
59
-
60
-
61
-
62
-
63
-
64
-
65
-
66
-
67
-
68
-
69
-
70
-
71
-
72
-
73
-
74
-
75
-
76
-
77
-
78
-
79
-
80
-
81
-
82
-
83
-
84
-
85
-
86
-
87
-
88
-
89
-
90
-
91
-
92
-
93
-
94
-
95
-
96
-
97
-
98
-
99
-
100
-
101
-
102
-
103
-
104
-
105
-
106
-
107
-
108
-
109
-
110
-
111
-
112
-
113
-
114
-
115
-
116
-
117
-
118
-
119
-
120
-
121
-
122
-
123
-
124
-
125
-
126
-
127
-
128
-
129
-
130
-
131
-
132
-
133
-
134
-
135
-
136
-
137
-
138
-
139
-
140
-
141
-
142
-
143
-
144
-
145
-
146
-
147
-
148
-
149
-
150
-
151
-
152
-
153
-
154
-
155
-
156
-
157
-
158
-
159
-
160
-
161
-
162
-
163
-
164
-
165
-
166
-
167
-
168
-
169
-
170
-
171
-
172
-
173
-
174
-
175
-
176
-
177
-
178
-
179
-
180
-
181
-
182
-
183
-
184
-
185
-
186
-
187
-
188
-
189
-
190
-
191
-
192
-
193
-
194
-
195
-
196
-
197
-
198
-
199
-
200
-
201
-
202
-
203
-
204
-
205
-
206
-
207
-
208
-
209
-
210
-
211
-
212
-
213
-
214
-
215
-
216
-
217
-
218
-
219
-
220
-
221
-
222
-
223
-
224
-
225
-
226
-
227
-
228
-
229
-
230
-
231
-
232
-
233
-
234
-
235
-
236
-
237
-
238
-
239
-
240
-
241
-
242
-
243
-
244
-
245
-
246
-
247
-
248
-
249
-
250
-
251
-
252
-
253
-
254
-
255
-
256
-
257
-
258
-
259
-
260
-
261
-
262
-
263
 |
 |

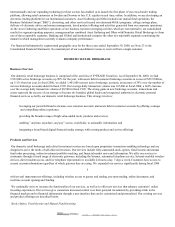
terms ranging from three months to five years. For those consumers who seek an even higher premium yield CD, we offer seven-to-ten
year callable CDs, which are subject to redemption by us anytime after two years.
We currently offer several financial products through strategic alliances with other companies. Through E-Loan, an online mortgage
broker, we offer co-branded, rate-competitive residential mortgage loans to our customers. Through InsWeb and Answer Financial
Inc., we offer insurance products, and through First USA, we offer credit card services. We are evaluating whether to offer proprietary
products in these areas.
Customers and Markets
We serve customers in all 50 states and several foreign countries. Over 68% of the Bank’ s customer base is concentrated in U.S.
major metropolitan areas. In line with our marketing efforts, the Bank’ s highest concentration of customers are found in the
cosmopolitan areas of Philadelphia (31.7%), New York (18.4%), Washington/Baltimore (15.3%), Los Angeles (8.0%), San Francisco
(5.0%) and Chicago (4.5%).
Operations
With E*TRADE and ETFC as savings and loan holding companies and the Bank as a federally chartered savings bank, we are subject
to extensive regulation, supervision and examination by the Office of Thrift Supervision (‘OTS’ ’ ) as our primary federal regulator. We
are also subject to regulation, supervision and examination by the FDIC. Further, as a financial services holding company, we are also
subject to the SEC’ s Industry Guide 3 reporting requirements. Certain disclosure of financial information required by Guide 3 with
respect to our banking services is provided below as a part of our discussion of banking operations.
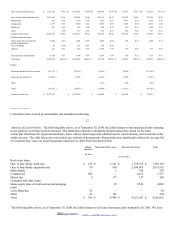
Prior to its acquisition, ETFC reported its results of operations on a fiscal year ending December 31. Because we report on a fiscal
year ending September 30, financial information contained in this document for fiscal 2000 and 1999 includes the results of ETFC for
the twelve months ended September 30, 2000 and 1999. Fiscal 1998, 1997 and 1996 include the results of ETFC for the twelve
months ended December 31, 1998, 1997 and 1996, respectively. Accordingly, the reconciliation of activities in certain accounts
presented herein for the year ended September 30, 1999 will begin with the October 1, 1998 balance, whereas the September 30, 1998
reconciliation will cover ETFC’ s operating period from January 1, 1998 through December 31, 1998. This reconciliation causes
certain amounts to be included in both fiscal 1999 and 1998.
10
Lending Activities
General . As part of our banking operations, we purchase whole loans and mortgage-backed and related securities rather than produce
or originate loans.
Loan Portfolio Composition. At September 30, 2000, our net loans receivable totaled $4.2 billion or 46.2% of total bank assets. As of
the same date, $4.2 billion, or 99.81%, of the total gross loan portfolio, consisted of one- to four-family residential mortgage loans.
Prior to 1990, we originated a limited number of loans for the purchase or construction of multi-family and commercial real estate.
However, as part of our general operating strategy and in response to risks associated with multi-family and commercial real estate
lending and prevailing economic conditions, we stopped originating and purchasing such loans. At September 30, 2000, multi-family,
commercial, and mixed-use real estate loans amounted to $3.4 million, or 0.08%, of our total gross loan portfolio. The loan portfolio
also included second trust residential mortgages, home equity lines of credit, automobile loans and loans secured by savings deposits
totaling $4.3 million, or 0.11%, of our total gross loan portfolio at September 30, 2000.
11
The following table presents information concerning our banking loan portfolio, in dollar amounts and in percentages, by type of loan.
September
30,
September
30,
September
30,
September
30,
September
30,
2000 % 1999 % 1998 % 1997 % 1996 %
(dollars in thousands)
Real estate loans:
2002. EDGAR Online, Inc.