Xcel Energy 2015 Annual Report Download - page 76
Download and view the complete annual report
Please find page 76 of the 2015 Xcel Energy annual report below. You can navigate through the pages in the report by either clicking on the pages listed below, or by using the keyword search tool below to find specific information within the annual report.-
 1
1 -
2
-
3
-
4
-
5
-
6
-
7
-
8
-
9
-
10
-
11
-
12
-
13
-
14
-
15
-
16
-
17
-
18
-
19
-
20
-
21
-
22
-
23
-
24
-
25
-
26
-
27
-
28
-
29
-
30
-
31
-
32
-
33
-
34
-
35
-
36
-
37
-
38
-
39
-
40
-
41
-
42
-
43
-
44
-
45
-
46
-
47
-
48
-
49
-
50
-
51
-
52
-
53
-
54
-
55
-
56
-
57
-
58
-
59
-
60
-
61
-
62
-
63
-
64
-
65
-
 66
66 -
 67
67 -
 68
68 -
 69
69 -
 70
70 -
 71
71 -
 72
72 -
 73
73 -
 74
74 -
 75
75 -
 76
76 -
 77
77 -
 78
78 -
 79
79 -
 80
80 -
 81
81 -
 82
82 -
 83
83 -
 84
84 -
 85
85 -
 86
86 -
87
-
88
-
89
-
90
-
91
-
92
-
93
-
94
-
95
-
96
-
97
-
98
-
99
-
100
-
101
-
102
-
103
-
104
-
105
-
106
-
107
-
108
-
109
-
110
-
111
-
112
-
113
-
114
-
115
-
116
-
117
-
118
-
119
-
120
-
121
-
122
-
123
-
124
-
125
-
126
-
127
-
128
-
129
-
130
-
131
-
132
-
133
-
134
-
135
-
136
-
137
-
138
-
139
-
140
-
141
-
142
-
143
-
144
-
145
-
146
-
147
-
148
-
149
-
150
-
151
-
152
-
153
-
154
-
155
-
156
-
157
-
158
-
159
-
160
-
161
-
162
-
163
-
164
-
165
-
166
-
167
-
168
-
169
-
170
-
171
-
172
-
173
-
174
-
175
-
176
-
177
-
178
-
179
-
180
 |
 |

58
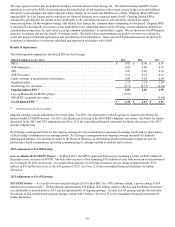
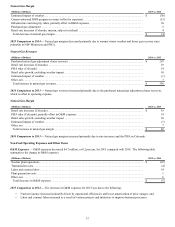
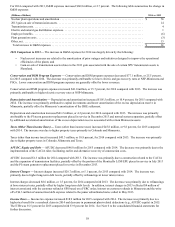
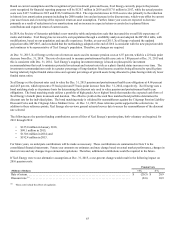
For 2014 compared with 2013, O&M expenses increased $60.8 million, or 2.7 percent. The following table summarizes the change in
O&M expenses:
(Millions of Dollars) 2014 vs. 2013
Nuclear plant operations and amortization . . . . . . . . . . . . . . . . . . . . . . . . . . . . . . . . . . . . . . . . . . . . . . . . . . . . . . . . . . $ 36
2013 gain on sale of transmission assets . . . . . . . . . . . . . . . . . . . . . . . . . . . . . . . . . . . . . . . . . . . . . . . . . . . . . . . . . . . . 14
Transmission costs. . . . . . . . . . . . . . . . . . . . . . . . . . . . . . . . . . . . . . . . . . . . . . . . . . . . . . . . . . . . . . . . . . . . . . . . . . . . . 4
Electric and natural gas distribution expenses. . . . . . . . . . . . . . . . . . . . . . . . . . . . . . . . . . . . . . . . . . . . . . . . . . . . . . . . 1
Employee benefits . . . . . . . . . . . . . . . . . . . . . . . . . . . . . . . . . . . . . . . . . . . . . . . . . . . . . . . . . . . . . . . . . . . . . . . . . . . . . (6)
Plant generation costs . . . . . . . . . . . . . . . . . . . . . . . . . . . . . . . . . . . . . . . . . . . . . . . . . . . . . . . . . . . . . . . . . . . . . . . . . . (3)
Other, net . . . . . . . . . . . . . . . . . . . . . . . . . . . . . . . . . . . . . . . . . . . . . . . . . . . . . . . . . . . . . . . . . . . . . . . . . . . . . . . . . . . . 15
Total increase in O&M expenses. . . . . . . . . . . . . . . . . . . . . . . . . . . . . . . . . . . . . . . . . . . . . . . . . . . . . . . . . . . . . . . . . $ 61
2014 Comparison to 2013 — The increase in O&M expenses for 2014 was largely driven by the following:
• Nuclear cost increases are related to the amortization of prior outages and initiatives designed to improve the operational
efficiencies of the plants; and
• Gain on sale of transmission assets relates to the 2013 gain associated with the sale of certain SPS’ transmission assets to
Sharyland.
Conservation and DSM Program Expenses — Conservation and DSM program expenses decreased $77.1 million, or 25.5 percent,
for 2015 compared with 2014. The decrease was primarily attributable to lower electric and gas recovery rates at NSP-Minnesota and
PSCo. Lower conservation and DSM program expenses are generally offset by lower revenues.
Conservation and DSM program expenses increased $41.0 million, or 15.7 percent, for 2014 compared with 2013. The increase was
primarily attributable to higher electric recovery rates at NSP-Minnesota.
Depreciation and Amortization — Depreciation and amortization increased $105.5 million, or 10.4 percent, for 2015 compared with
2014. The increase was primarily attributed to capital investments and lower amortization of the excess depreciation reserve in
Minnesota, partially offset by Minnesota’s amortization of the DOE settlement.
Depreciation and amortization increased $41.2 million, or 4.2 percent, for 2014 compared with 2013. The increase was primarily
attributable to the PI steam generator replacement placed in service in December 2013 and normal system expansion, partially offset
by additional accelerated amortization of the excess depreciation reserve associated with certain Minnesota assets.
Taxes (Other Than Income Taxes) — Taxes (other than income taxes) increased $45.8 million, or 9.8 percent, for 2015 compared
with 2014. The increase was due to higher property taxes primarily in Colorado and Minnesota.
Taxes (other than income taxes) increased $45.3 million, or 10.8 percent, for 2014 compared with 2013. The increase was primarily
due to higher property taxes in Colorado, Minnesota and Texas.
AFUDC, Equity and Debt — AFUDC decreased $46.0 million for 2015 compared with 2014. The decrease was primarily due to the
implementation of the CACJA rider, facilitating earlier and alternative recovery of construction costs.
AFUDC increased $1.3 million for 2014 compared with 2013. The increase was primarily due to construction related to the CACJA
and the expansion of transmission facilities, partially offset by the portion of the Monticello LCM/EPU placed in service in July 2013
and the PI steam generator replacement placed in service in December 2013.
Interest Charges — Interest charges increased $28.7 million, or 5.1 percent, for 2015 compared with 2014. The increase was
primarily due to higher long-term debt levels, partially offset by refinancings at lower interest rates.
Interest charges decreased $8.6 million, or 1.5 percent, for 2014 compared with 2013. The decrease was primarily due to refinancings
at lower interest rates, partially offset by higher long-term debt levels. In addition, interest charges in 2013 reflected $4 million of
interest associated with the customer refund at SPS based on a FERC order, interest on customer refunds in Minnesota and the write
off of $6.3 million of unamortized debt expense related to the junior subordinated notes called in May 2013.
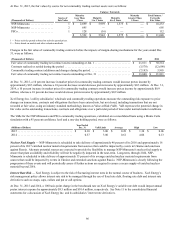
Income Taxes — Income tax expense increased $18.9 million for 2015 compared with 2014. The increase was primarily due to a
higher tax benefit for a carryback claim in 2014 and decrease in permanent plant-related deductions (e.g., AFUDC-equity) in 2015.
The ETR was 35.5 percent for 2015 compared with 33.9 percent for 2014. See Note 6 to the consolidated financial statements for
further discussion.