Xcel Energy 2015 Annual Report Download - page 62
Download and view the complete annual report
Please find page 62 of the 2015 Xcel Energy annual report below. You can navigate through the pages in the report by either clicking on the pages listed below, or by using the keyword search tool below to find specific information within the annual report.-
 1
1 -
2
-
3
-
4
-
5
-
6
-
7
-
8
-
9
-
10
-
11
-
12
-
13
-
14
-
15
-
16
-
17
-
18
-
19
-
20
-
21
-
22
-
23
-
24
-
25
-
26
-
27
-
28
-
29
-
30
-
31
-
32
-
33
-
34
-
35
-
36
-
37
-
38
-
39
-
40
-
41
-
42
-
43
-
44
-
45
-
46
-
47
-
48
-
49
-
50
-
51
-
 52
52 -
 53
53 -
 54
54 -
 55
55 -
 56
56 -
 57
57 -
 58
58 -
 59
59 -
 60
60 -
 61
61 -
 62
62 -
 63
63 -
 64
64 -
 65
65 -
 66
66 -
 67
67 -
 68
68 -
 69
69 -
 70
70 -
 71
71 -
 72
72 -
73
-
74
-
75
-
76
-
77
-
78
-
79
-
80
-
81
-
82
-
83
-
84
-
85
-
86
-
87
-
88
-
89
-
90
-
91
-
92
-
93
-
94
-
95
-
96
-
97
-
98
-
99
-
100
-
101
-
102
-
103
-
104
-
105
-
106
-
107
-
108
-
109
-
110
-
111
-
112
-
113
-
114
-
115
-
116
-
117
-
118
-
119
-
120
-
121
-
122
-
123
-
124
-
125
-
126
-
127
-
128
-
129
-
130
-
131
-
132
-
133
-
134
-
135
-
136
-
137
-
138
-
139
-
140
-
141
-
142
-
143
-
144
-
145
-
146
-
147
-
148
-
149
-
150
-
151
-
152
-
153
-
154
-
155
-
156
-
157
-
158
-
159
-
160
-
161
-
162
-
163
-
164
-
165
-
166
-
167
-
168
-
169
-
170
-
171
-
172
-
173
-
174
-
175
-
176
-
177
-
178
-
179
-
180
 |
 |

44
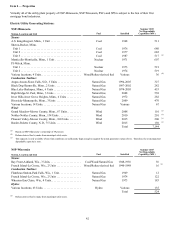
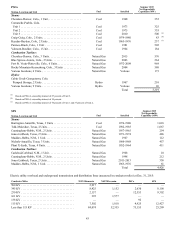
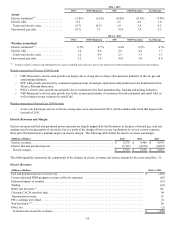
Electric utility transmission and distribution substations at Dec. 31, 2015:
NSP-Minnesota NSP-Wisconsin PSCo SPS
Quantity. . . . . . . . . . . . . . . . . . . . . . . . . . . . . . . . . . . . . 349 204 229 444
Natural gas utility mains at Dec. 31, 2015:
Miles NSP-Minnesota NSP-Wisconsin PSCo WGI
Transmission. . . . . . . . . . . . . . . . . . . . . . . . . . . . . . . . . 136 — 2,278 11
Distribution . . . . . . . . . . . . . . . . . . . . . . . . . . . . . . . . . . 10,084 2,342 22,045 —
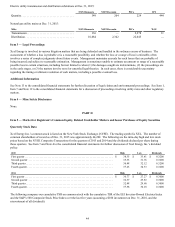
Item 3 — Legal Proceedings
Xcel Energy is involved in various litigation matters that are being defended and handled in the ordinary course of business. The
assessment of whether a loss is probable or is a reasonable possibility, and whether the loss or a range of loss is estimable, often
involves a series of complex judgments about future events. Management maintains accruals for such losses that are probable of
being incurred and subject to reasonable estimation. Management is sometimes unable to estimate an amount or range of a reasonably
possible loss in certain situations, including but not limited to when (1) the damages sought are indeterminate, (2) the proceedings are
in the early stages, or (3) the matters involve novel or unsettled legal theories. In such cases, there is considerable uncertainty
regarding the timing or ultimate resolution of such matters, including a possible eventual loss.
Additional Information
See Note 13 to the consolidated financial statements for further discussion of legal claims and environmental proceedings. See Item 1,
Item 7 and Note 12 to the consolidated financial statements for a discussion of proceedings involving utility rates and other regulatory
matters.
Item 4 — Mine Safety Disclosures
None.
PART II
Item 5 — Market for Registrant’s Common Equity, Related Stockholder Matters and Issuer Purchases of Equity Securities
Quarterly Stock Data
Xcel Energy Inc.’s common stock is listed on the New York Stock Exchange (NYSE). The trading symbol is XEL. The number of
common shareholders of record as of Dec. 31, 2015 was approximately 64,202. The following are the intra-day high and low stock
prices based on the NYSE Composite Transactions for the quarters of 2015 and 2014 and the dividends declared per share during
those quarters. See Item 7 and Note 4 to the consolidated financial statements for further discussion of Xcel Energy Inc.’s dividend
policy.
2015 High Low Dividends
First quarter. . . . . . . . . . . . . . . . . . . . . . . . . . . . . . . . . . . . . . . . . . . . . . . . . . . . . . . . . . . . . . . . . $ 38.35 $ 33.41 $ 0.3200
Second quarter . . . . . . . . . . . . . . . . . . . . . . . . . . . . . . . . . . . . . . . . . . . . . . . . . . . . . . . . . . . . . . 35.35 31.76 0.3200
Third quarter . . . . . . . . . . . . . . . . . . . . . . . . . . . . . . . . . . . . . . . . . . . . . . . . . . . . . . . . . . . . . . . . 36.48 32.12 0.3200
Fourth quarter . . . . . . . . . . . . . . . . . . . . . . . . . . . . . . . . . . . . . . . . . . . . . . . . . . . . . . . . . . . . . . . 37.25 34.33 0.3200
2014 High Low Dividends
First quarter. . . . . . . . . . . . . . . . . . . . . . . . . . . . . . . . . . . . . . . . . . . . . . . . . . . . . . . . . . . . . . . . . $ 30.77 $ 27.27 $ 0.3000
Second quarter . . . . . . . . . . . . . . . . . . . . . . . . . . . . . . . . . . . . . . . . . . . . . . . . . . . . . . . . . . . . . . 32.37 29.83 0.3000
Third quarter . . . . . . . . . . . . . . . . . . . . . . . . . . . . . . . . . . . . . . . . . . . . . . . . . . . . . . . . . . . . . . . . 32.48 29.60 0.3000
Fourth quarter . . . . . . . . . . . . . . . . . . . . . . . . . . . . . . . . . . . . . . . . . . . . . . . . . . . . . . . . . . . . . . . 37.58 30.18 0.3000
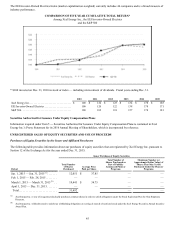
The following compares our cumulative TSR on common stock with the cumulative TSR of the EEI Investor-Owned Electrics Index
and the S&P’s 500 Composite Stock Price Index over the last five years (assuming a $100 investment on Dec. 31, 2010, and the
reinvestment of all dividends).