Xcel Energy 2015 Annual Report Download - page 161
Download and view the complete annual report
Please find page 161 of the 2015 Xcel Energy annual report below. You can navigate through the pages in the report by either clicking on the pages listed below, or by using the keyword search tool below to find specific information within the annual report.-
 1
1 -
2
-
3
-
4
-
5
-
6
-
7
-
8
-
9
-
10
-
11
-
12
-
13
-
14
-
15
-
16
-
17
-
18
-
19
-
20
-
21
-
22
-
23
-
24
-
25
-
26
-
27
-
28
-
29
-
30
-
31
-
32
-
33
-
34
-
35
-
36
-
37
-
38
-
39
-
40
-
41
-
42
-
43
-
44
-
45
-
46
-
47
-
48
-
49
-
50
-
51
-
52
-
53
-
54
-
55
-
56
-
57
-
58
-
59
-
60
-
61
-
62
-
63
-
64
-
65
-
66
-
67
-
68
-
69
-
70
-
71
-
72
-
73
-
74
-
75
-
76
-
77
-
78
-
79
-
80
-
81
-
82
-
83
-
84
-
85
-
86
-
87
-
88
-
89
-
90
-
91
-
92
-
93
-
94
-
95
-
96
-
97
-
98
-
99
-
100
-
101
-
102
-
103
-
104
-
105
-
106
-
107
-
108
-
109
-
110
-
111
-
112
-
113
-
114
-
115
-
116
-
117
-
118
-
119
-
120
-
121
-
122
-
123
-
124
-
125
-
126
-
127
-
128
-
129
-
130
-
131
-
132
-
133
-
134
-
135
-
136
-
137
-
138
-
139
-
140
-
141
-
142
-
143
-
144
-
145
-
146
-
147
-
148
-
149
-
150
-
 151
151 -
 152
152 -
 153
153 -
 154
154 -
 155
155 -
 156
156 -
 157
157 -
 158
158 -
 159
159 -
 160
160 -
 161
161 -
 162
162 -
 163
163 -
 164
164 -
 165
165 -
 166
166 -
 167
167 -
 168
168 -
 169
169 -
 170
170 -
 171
171 -
172
-
173
-
174
-
175
-
176
-
177
-
178
-
179
-
180
 |
 |

143
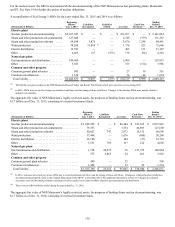
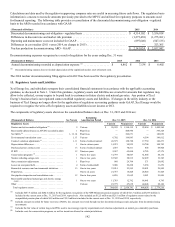
The components of regulatory liabilities shown on the consolidated balance sheets at Dec. 31, 2015 and 2014 are:
(Thousands of Dollars) See Note(s) Remaining
Amortization Period Dec. 31, 2015 Dec. 31, 2014
Regulatory Liabilities Current Noncurrent Current Noncurrent
Plant removal costs . . . . . . . . . . . . . . . . . . . . . . . . . . . . . . 1, 13 Plant lives $ — $ 1,131,023 $ — $ 953,660
Investment tax credit deferrals . . . . . . . . . . . . . . . . . . . . . 1, 6 Various — 48,985 — 52,666
Deferred income tax adjustment. . . . . . . . . . . . . . . . . . . . 1, 6 Various — 46,737 — 48,622
Renewable resources and environmental initiatives. . . . . 12, 13 Various 6,271 41,869 10,427 10,376
PSCo earnings test . . . . . . . . . . . . . . . . . . . . . . . . . . . . . . 12 One to two years 42,868 9,472 57,127 42,819
Gas pipeline inspection costs . . . . . . . . . . . . . . . . . . . . . . Various 1,140 4,273 13,970 642
Gain from asset sales . . . . . . . . . . . . . . . . . . . . . . . . . . . . 12 Various 2,640 2,584 2,893 4,472
Deferred electric and steam production and natural gas
costs . . . . . . . . . . . . . . . . . . . . . . . . . . . . . . . . . . . . . . . 1 Less than one year 146,235 — 88,527 —
Conservation programs (a) . . . . . . . . . . . . . . . . . . . . . . . . . 1, 12 Less than one year 34,444 — 103,351 —
Contract valuation adjustments (b). . . . . . . . . . . . . . . . . . . 1, 11 Term of related contract 21,661 — 55,751 2,521
DOE settlement. . . . . . . . . . . . . . . . . . . . . . . . . . . . . . . . . 12 One to two years 16,139 — 49,492 —
Low income discount program . . . . . . . . . . . . . . . . . . . . . Less than one year 2,475 — 3,355 —
Excess depreciation reserve . . . . . . . . . . . . . . . . . . . . . . . Less than one year 60 — 10,999 —
Other . . . . . . . . . . . . . . . . . . . . . . . . . . . . . . . . . . . . . . . . . Various 32,897 47,946 14,837 47,651
Total regulatory liabilities (c) . . . . . . . . . . . . . . . . . . . . . $ 306,830 $ 1,332,889 $ 410,729 $ 1,163,429
(a) Includes costs for conservation programs, as well as incentives allowed in certain jurisdictions.
(b) Includes the fair value of certain long-term PPAs used to meet energy capacity requirements and valuation adjustments on natural gas commodity purchases.
(c) Revenue subject to refund of $75.0 million and $128.3 million for 2015 and 2014, respectively, is included in other current liabilities.
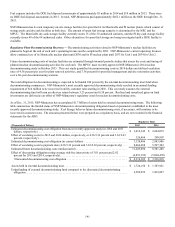
At Dec. 31, 2015 and 2014, approximately $169 million and $323 million of Xcel Energy’s regulatory assets represented past
expenditures not currently earning a return, respectively. This amount primarily includes recoverable purchased natural gas and
electric energy costs and certain expenditures associated with renewable resources and environmental initiatives.
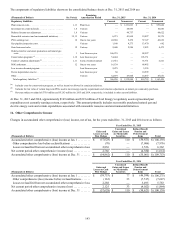
16. Other Comprehensive Income
Changes in accumulated other comprehensive (loss) income, net of tax, for the years ended Dec. 31, 2015 and 2014 were as follows:
Year Ended Dec. 31, 2015
(Thousands of Dollars)
Gains and
Losses on Cash
Flow Hedges
Unrealized
Gains and Losses
on Marketable
Securities
Defined Benefit
Pension and
Postretirement
Items Total
Accumulated other comprehensive (loss) income at Jan. 1 . . . . . . . . . $ (57,628) $ 110 $ (50,621) $ (108,139)
Other comprehensive loss before reclassifications . . . . . . . . . . . . . . (70) — (7,906) (7,976)
Losses reclassified from net accumulated other comprehensive loss 2,836 — 3,526 6,362
Net current period other comprehensive income (loss) . . . . . . . . . . . . 2,766 — (4,380) (1,614)
Accumulated other comprehensive (loss) income at Dec. 31 . . . . . . . $ (54,862) $ 110 $ (55,001) $ (109,753)
Year Ended Dec. 31, 2014
(Thousands of Dollars)
Gains and
Losses on Cash
Flow Hedges
Unrealized
Gains and Losses
on Marketable
Securities
Defined Benefit
Pension and
Postretirement
Items Total
Accumulated other comprehensive (loss) income at Jan. 1 . . . . . . . . . $ (59,753) $ 77 $ (46,599) $ (106,275)
Other comprehensive (loss) income before reclassifications. . . . . . . (163) 33 (7,517) (7,647)
Losses reclassified from net accumulated other comprehensive loss 2,288 — 3,495 5,783
Net current period other comprehensive income (loss) . . . . . . . . . . . . 2,125 33 (4,022) (1,864)
Accumulated other comprehensive (loss) income at Dec. 31 . . . . . . . $ (57,628) $ 110 $ (50,621) $ (108,139)