Xcel Energy 2015 Annual Report Download - page 40
Download and view the complete annual report
Please find page 40 of the 2015 Xcel Energy annual report below. You can navigate through the pages in the report by either clicking on the pages listed below, or by using the keyword search tool below to find specific information within the annual report.-
 1
1 -
2
-
3
-
4
-
5
-
6
-
7
-
8
-
9
-
10
-
11
-
12
-
13
-
14
-
15
-
16
-
17
-
18
-
19
-
20
-
21
-
22
-
23
-
24
-
25
-
26
-
27
-
28
-
29
-
 30
30 -
 31
31 -
 32
32 -
 33
33 -
 34
34 -
 35
35 -
 36
36 -
 37
37 -
 38
38 -
 39
39 -
 40
40 -
 41
41 -
 42
42 -
 43
43 -
 44
44 -
 45
45 -
 46
46 -
 47
47 -
 48
48 -
 49
49 -
 50
50 -
51
-
52
-
53
-
54
-
55
-
56
-
57
-
58
-
59
-
60
-
61
-
62
-
63
-
64
-
65
-
66
-
67
-
68
-
69
-
70
-
71
-
72
-
73
-
74
-
75
-
76
-
77
-
78
-
79
-
80
-
81
-
82
-
83
-
84
-
85
-
86
-
87
-
88
-
89
-
90
-
91
-
92
-
93
-
94
-
95
-
96
-
97
-
98
-
99
-
100
-
101
-
102
-
103
-
104
-
105
-
106
-
107
-
108
-
109
-
110
-
111
-
112
-
113
-
114
-
115
-
116
-
117
-
118
-
119
-
120
-
121
-
122
-
123
-
124
-
125
-
126
-
127
-
128
-
129
-
130
-
131
-
132
-
133
-
134
-
135
-
136
-
137
-
138
-
139
-
140
-
141
-
142
-
143
-
144
-
145
-
146
-
147
-
148
-
149
-
150
-
151
-
152
-
153
-
154
-
155
-
156
-
157
-
158
-
159
-
160
-
161
-
162
-
163
-
164
-
165
-
166
-
167
-
168
-
169
-
170
-
171
-
172
-
173
-
174
-
175
-
176
-
177
-
178
-
179
-
180
 |
 |

22
Potash Junction Substation to Roadrunner Substation 345 KV Transmission Line — In December 2014, the NMPRC issued a CCN
for a new 345 KV transmission line from the Potash Junction substation to the Roadrunner substation, both near Carlsbad, N.M. The
transmission line is 40 miles long and cost $59.6 million. The line was placed into service in October 2015.
TUCO Substation to Yoakum County Substation to Hobbs Plant Substation 345 KV Transmission Line — In June 2015, SPS filed a
CCN with the PUCT for the Yoakum County to Texas/New Mexico State line portion of this 345 KV line project and the PUCT is
expected to approve this CCN in the first quarter of 2016. This line will connect the TUCO substation near Lubbock, Texas with the
Yoakum County substation, continuing on to the Hobbs Plant substation near Hobbs, New Mexico. CCNs for the TUCO to Yoakum
County line segment and for the Texas/New Mexico state line to Hobbs Plant segment are planned to be filed in mid-2016. The
estimated project cost is $242 million. This line is scheduled to be in service in 2020.
Hobbs Plant Substation to China Draw Substation 345 KV Transmission Line — The Hobbs Plant to China Draw transmission line
will connect the Hobbs Plant substation to the China Draw substation near Malaga, N.M. with terminations at a proposed Kiowa
substation near Carlsbad, N.M. and at the North Loving substation, near Loving, N.M. SPS plans to file a CCN for this line in New
Mexico during spring 2016. The estimated project cost is $139 million. The line is anticipated to be in service in 2018.
SPS Resource Plans — SPS was required to develop and implement a renewable portfolio plan by 2015, in which 15 percent of its
energy to serve its New Mexico retail customers is produced by renewable resources. The requirement was met through PPAs,
including wind, solar and distributive generation. In 2020, the renewable resource production requirement increases to 20 percent. In
addition, SPS indicated that it was evaluating water supply issues at its Tolk facility and if additional investment is required to operate
the plant through its existing life.
Texas Legislation — In June 2015, the Texas Governor signed HB 1535 into law. As a result, SPS may reduce regulatory lag through
earlier inclusion of certain capital additions in rate base, as well as expediting the implementation of new rates. Key provisions of the
bill are as follows:
• Utilities may include actual and estimated post-test year capital additions up through 30-days before the filing date;
• A new natural gas generating unit may be included in rate base as long as it is in service before the proposed effective rate
date;
• Rates will go into effect 155 days after filing (previously it was 185 days). If the case is not final by this date, then a utility
can go back and surcharge; and
• Establishes time limits for the PUCT to rule on a new generation plant request for a certificate of convenience and necessity.
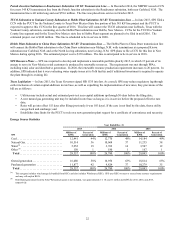
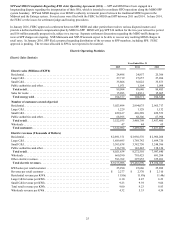
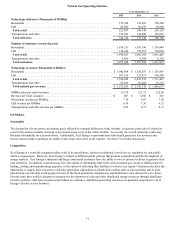
Energy Source Statistics
Year Ended Dec. 31
2015 2014 2013
SPS Millions of
KWh Percent of
Generation Millions of
KWh Percent of
Generation Millions of
KWh Percent of
Generation
Coal. . . . . . . . . . . . . . . . . . . . . . . . . . . . . . . . 12,441 44% 12,770 48% 14,184 49%
Natural Gas . . . . . . . . . . . . . . . . . . . . . . . . . . 10,514 36 10,068 37 11,235 38
Wind (a) . . . . . . . . . . . . . . . . . . . . . . . . . . . . . 5,252 19 3,762 14 3,507 12
Other (b) . . . . . . . . . . . . . . . . . . . . . . . . . . . . . 150 1 180 1 167 1
Total . . . . . . . . . . . . . . . . . . . . . . . . . . . . . . 28,357 100% 26,780 100% 29,093 100%
Owned generation . . . . . . . . . . . . . . . . . . . . . 16,480 58% 16,956 63% 18,814 65%
Purchased generation . . . . . . . . . . . . . . . . . . 11,877 42 9,824 37 10,279 35
Total . . . . . . . . . . . . . . . . . . . . . . . . . . . . . . 28,357 100% 26,780 100% 29,093 100%
(a) This category includes wind energy de-bundled from RECs and also includes Windsource RECs. SPS uses RECs to meet or exceed state resource requirements
and may sell surplus RECs.
(b) Distributed generation from the Solar*Rewards program is not included, was approximately 13, 10, and 11 million net KWh for 2015, 2014, and 2013,
respectively.